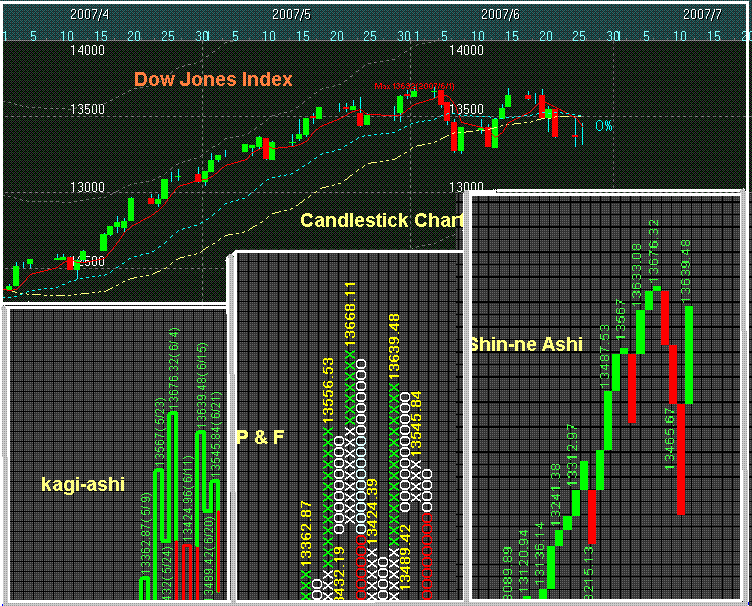
Hilow Chart V9.06E Screenshot

The charting technique and analysis has become very popular among investors. Charts have been employed worldwidely as the primary tool and often reflect short or long term trends. Also, the charting technique shows us the critical points to determine buy or sell timing, support or resistance price levels, and signal strength. In order to improve your investing efficiency, chart analysis is essential. "Hilow Chart" is one of the most comprehensive charting software in the market, which allows to make technical analysis with more than three dozens different types of charts and indices for securities or commodity prices in markets. In addition to traditional charts such as, MACD, Stochastics, RSI, SAR, Momentum, Bollinger, Envelope, RCI, OBV, etc.. "Hilow Chart" offers several unique and popular Japanese extraordinary technique and charts. Nowadays, candlestick techniques are widely used that originated in the style of technical charting used by the Japanese for over 100 years before the West developed the bar chart. "Hilow Chart" provides more than Candlestick chart, such as Kagi-ashi, Renko-ashi, Shin-ne-ashi, Ichimokukinkohyo, and Heikin-ashi etc.. These are now gaining more popular to us. The combination use of the East-West charting technique can improve both the visual assessment of the trend in the time frame chosen, and accuracy of many trading signals. A newly introduced feature, "Trading Point Indicator", is an excellent leading indicator and easy to use even for novice investors, neither complex nor difficult. You can clearly see buy or sell signals on the chart. As "Hilow Chart" creates multiple charts, you will find different features and characteristics by comparing one to another. Depending on your investing style or conditions(time or investing capital), you may choose the most suitable chart to the securities in your portfolio.
Back to Hilow Chart V9.06E Details page
- Active Primary Flip Chart Star Chart
- Excel Solar Chart Sun Chart
- Office Clock Chart Pie Chart
- Army Fitness Chart Score Chart
- Business Flow Chart Symbol Chart
- Net Chart Control Nasosoft Chart
- Fusion Chart Flow Chart
- Satellite Chart Chart Pic
- Wall Chart Component Chart
- Chart Component Chart Component Net
