OLAPCharts for SharePoint Screenshot
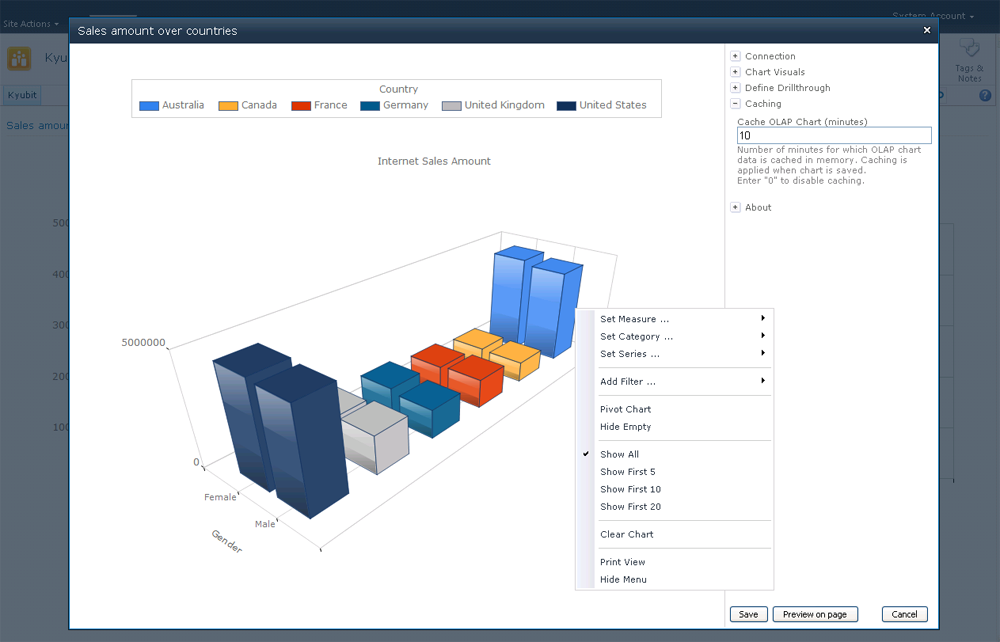
Interactive OLAP Charts for SharePoint 2010 provides SharePoint web parts for charting and visual analysis of your OLAP cube data. Easy to set up, and integrate in your existing SharePoint sites. Visualize OLAP data with analysis functionalities which supports visual drilling, slicing, isolating and drillthroughs. With available caching options, provides tool for OLAP data presentation to large number of users in your organization.
OLAPCharts for SharePoint is standalone SharePoint 2010 solution for visual OLAP analysis and charting. Primary advantage is to quickly setup and start visual OLAP analysis and set OLAP charts for other users on your SharePoint pages. It takes only few clicks to drop web part, connect to OLAP data source and get your first OLAP chart done. It consists of a web part ( and underlying software architecture ) that is available to drop on SharePoint page and create OLAP charts, as well as interactive OLAP analysis. Visual details allows users to fine tune OLAP chart visual elements for best visual integration of OLAP chart into existing page. Drillthrough functionalities allow users to further analyze given data in a separate drillthrough window. Caching abilities allows displaying of OLAP charts without need to connecto to defined OLAP data source.
Back to OLAPCharts for SharePoint Details page
- Sharepoint Calendar Sharepoint Designer
- Sharepoint Newsletter
- Sharepoint Quiz
- Sharepoint Rank
- Sharepoint Ranking
- Filters Sharepoint
- Sharepoint Redirect
- Sharepoint Request
- Sharepoint Reservation
- Ext Js Sharepoint