Nevron Chart for SSRS Screenshot
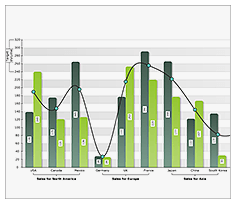
Nevron Chart for SQL Server Reporting Services (SSRS) is an advanced report item, delivering a complete set of 2D and 3D charting types, highly customizable axes, tight data integration and unmatched visual effects to your reports. It instantly improves your report authoring experience, with its polished visual editors, exhaustive and refined settings and well-organized structure.
Nevron Chart for SSRS is an indispensible tool for any serious Business Intelligence, Scorecard, Presentation, Scientific or general purpose report.
Features include:
- Multiple Charting Areas.
- Multiple Legends.
- Multiple Titles.
- Complete set of 2D/3D Charting Types.
- Advanced Axis Model.
- The industry-leading set of XY and XYZ scatter charts.
- The industry-leading support for 3D charting.
- The only chart for SSRS with Grid, Mesh and Triangulated Surface Charts.
- The only chart for SSRS with Photoshop-like effects.
- The only chart for SSRS with HTML-like rich-text formatting.
- Seamless integration with SQL Server Reporting Services 2005 and 2008.
Back to Nevron Chart for SSRS Details page
- Nevron Ssrs Vision
- Nevron Chart
- Nevron Chart For Net
- Nevron Chart For Sharepoint
- Nevron Chart Annotations
- Nevron Diagram
- Nevron Charts
- Nevron Event
- Nevron Net Vision
- Nevron Diagram For Net