OLAP Reporting Tool for Excel Screenshot
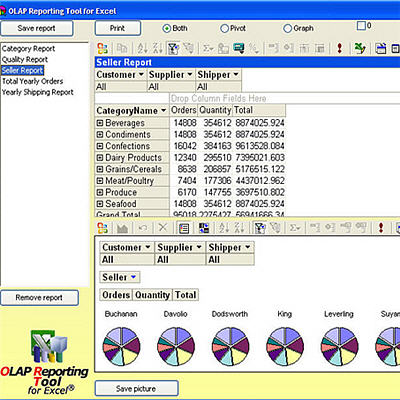
Data for business intelligence (BI) is of little use until it is converted into the information that decision makers need. OLAP Reporting Tool for Excel facilitates business intelligence by helping management to explore and draw conclusions from huge amounts of data. The application extends the built-in OLAP features in Excel to make them easier work with, especially for workgroups. Users can share customized reports easily. Either display a graph or a table or combinations of both. Choose between all the Excel graph types and also use the multi-graph feature to display multiple graphs side by side, compared on any set of data. Connects to a .cub file or directly to MS Analysis Services. Free of charge for all users. Nothing installed on the client - simply run the executable, it will look for .cub files or let you connect to the server. Video demonstrations, manual, slide show and FAQ:s available on the web site. New for version 3 is the possibility to describe reports, in categories or with free text (.html editor). OLAP Reporting supports fifteen European languages and automatically gets the same language as the systems OS. If that is not supported the language is English.
Features :
Filtering
Data drill-down
Export to Microsoft Excel
Save picture of graphs as .gif file
Custom reports generator
Multiple graphs (requires Excel 2002 or later)
3-D graphs
Compatible with IE7, Microsoft Vista and Office 2007
Supports Analysis Server 2005
Supports multiple .cub files
Report descriptions after categories or as free .html text
Back to OLAP Reporting Tool for Excel Details page
- Olap Reporting
- Reporting Service Olap
- Olap Reporting Service
- Silverlight Reporting Olap
- Reporting Services Viewer Olap
- Reporting Services Olap Cube
- Excel Reporting Tool
- Shareware Excel Reporting Tool
- Olap Report Tool
- Pivot Olap Excel