OfficeReports Screenshot
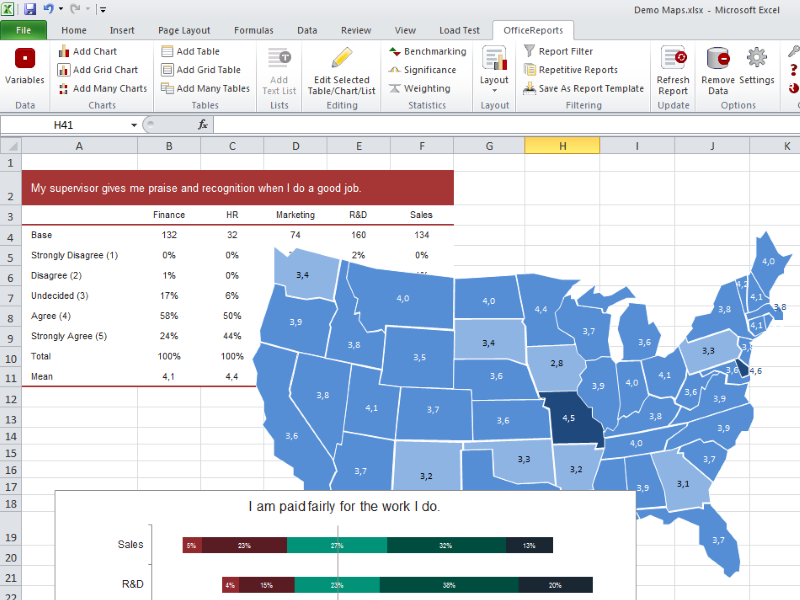
OfficeReports makes it easy to create charts, tables and other infographics in your workbooks, presentations and documents in the layout you like! No matter if you have your data in Excel or SPSS format, or would like to connect directly to your SurveyMonkey survey. This saves lots of time and reduces the risk of errors!
You can create your own layout definitions, and create your reports directly in the right layout. OfficeReports also has functionality for the more advanced users, e.g. weighting and statistical tests.
Using OfficeReports, you only have to do the hard work once. Almost everything you define can be reused, and that saves a lot of time.
- Once you have defined your "layout definitions", they will be available for all users, and for all presentations and documents.
- Once you are ready defining a chart or a crosstab, you can just copy and paste it. Edit the copy, select another variable, and you are ready with the next chart/crosstab. No need to define all options again.
- In the same way, you can copy a complete PowerPoint slide, and reuse it for reporting other variables.
- You can even reuse the whole report!
Share your reports. OfficeReports embeds the data into the workbooks, presentations and documents. You can just email your report to your colleague, and your colleagues can continue your work. If you do not want to send the report to your customer without the data, you can just remove it.
Back to OfficeReports Details page