TinyGraphs Screenshot
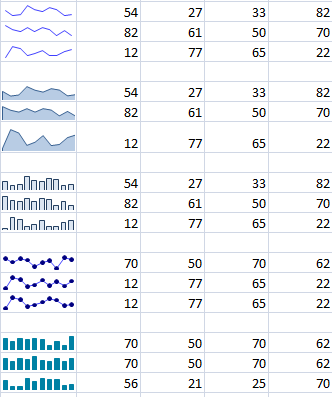
TinyGraphs is an open source Excel add-in that creates sparklines, mini column graphs, and area graphs from a row of data. It generates beautiful tiny graphics that are as small as a cell and can be placed next to the items that they describe. The tiny graphics, or sparklines, are as tall as the text around them and are useful for visualizing large quantities of data, such as stock prices and exchange rates.
The TinyGraphs plug-in creates a sparkline for every row of data in a rectangular block of cells. It currently supports three types of charts - Lines, Area and Column - with additional options for setting markers and customizing the colors for each chart type. As the tiny graphics generated by the plug-in are just Excel charts, they can be further reformatted for more variations, like soft shadows, 3D and glow effects.
Back to TinyGraphs Details page