PCWin Software Download Center
 
Product Home
Download Trial
Purchase
Author Site

Category

 
Audio
Business & Finance
Desktop Enhancements
DVD & Video
Games
Home & Education
Alarm Applications
Astrology & Numerology
Calendars & Planners
Clocks
E-books & Literature
Food & Beverage
Genealogy
Health & Nutrition
Hobbies
Home Inventory
Kids & Parenting
Language
Mathematics
Miscellaneous
Music
Religion & Spirituality
Science
Sports
Sticky Notes
Teaching Tools
Wining & Dining
Internet
Multimedia & Design
Security & Privacy
Software Development
Utilities
Web Authoring


Popular Downloads

 
TubeHunter Ultra
EasySystemCleaner
More than 30.000 vista icons
Aurora Web Editor 2007 Professional
MySpeed PC Lite
eScan Pro Edition
HelpVistaXPDiamond
WAB-Processor
Win Guard Pro
Antivirus Premium
 

New Downloads

 
Flash Forum
Aerize Email Alerts
WorkTime
MultiFind
SQLBackupAndFTP
Income Calculator Pro
Effective File Search
Open PGP command line
Text Speaker
ImageConverterPro
 

Related Downloads

 
Data Visualization
Data Table
Jdbc Data Table
.Net Bar Graphs
Bar Graphs 3d
Graphs And .Swf
Pie Graphs Free
Bingo Graphs
Draw Graphs Ln
Bar Graphs Exam
 

Visual Data

Visual Data 2.1.2

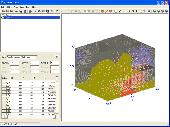
Creating graphs of regular data and irregular data. Creating vertex, grid and surface model, color map, contour plot, vector plot, 4D scatter, 4D slice and 4D vector. Download Visual Data by GraphNow

Screenshot of Visual Data
Publisher: GraphNow
License: Shareware
Price: USD $59.95
Filesize: 2.6 MB
Date Added: 10/28/2006

Creating graphs of regular data and irregular data. Creating vertex, grid and surface model, Delaunay triangles, color map, contour plot, vector plot, 3D contour plot, 4D scatter, 4D slice and 4D vector.

Category: Home & Education / Science


Download | Homepage | Buy Now | Screenshot | Report Error

Related Software

Contour Map Data Graphs Data Visualization Table Graphs
Function Grapher - Function Grapher is an easy-to-use software for 2D, 2.5D and 3D function graphing, animation and table data visualization.
Grapholic - Grapholic is an extremely useful tool for maximizing data visualization. You can convert your raw data into meaningful Graphs in just a few clicks. The simple steps you follow are Import, plot, modify and export to get your data in graphical form.
DPlot - Graphing software for scientists, engineers, and students. It features multiple scaling types, including linear, logarithmic, and probability scales, as well as several special purpose XY graphs and contour plots of 3D data.
SmileLab - SmileLab is a data visualization and automation software for Mac OS X.
Grab It! XP - Digitize graphs and charts quickly with our Excel based spreadsheet software. Log, linear, date and time scales, distance measurement and angle determination capability also. Free upgrades forever!
DigitizeIt - DigitizeIt can automatically digitize (x,y)-data from scanned graphs. Data values are transformed to a specified axes system and can be saved in ASCII format, ready to use in other applications. Can read most image formats (gif, png, tiff,bmp).
csXGraph - ActiveX control to draw 2D pie charts, bar charts & line graphs. Display the graphs, export to file (GIF, PNG, BMP) or data stream or copy to the clipboard. Properties allow full control over colours and fonts. Free trial.
RouterConsole - RouterConsole fetches Routing table, ARP table, Interface Table, Interface details and displays different interface graphs and Interface details.In addition it also fetches Cisco specific tables like memory, process, ip-accounting from Cisco devices.
MathCalc - MathCalc run with the calculator and graph plotter mode.
SwifferChart - SwifferChart generates dynamic business graphs in flash with just XML input+ Present data in the most vivid platform best suited for intranet or web-based applications+ Makes data visualization easy with various chart types: + multi-series line chart

More Software of "GraphNow"

Function Grapher - Function Grapher is an easy-to-use software for 2D, 2.5D and 3D function graphing, animation and table data visualization.
Math Calculator - To calculate expression, derivative, root, extremum, integral.
Math Studio - Math tool for high school teachers and students. Function graphing and analyzing, sequence of number, analytic geometry and solid geometry.
Complex Grapher - Complex Grapher is a graphing calculator to create a graph of complex function. 3D function graphs and 2D color maps can be created with this grapher.
Visual Fractal - Visual Fractal is an interesting grapher to create a graph of fractal.
Equation Grapher - Equation grapher is an easy-to-use software for 2D function graphing.
 

Copyright © 1995-2008 PCWin Download Center. Home | | Privacy | Link to Us | Submit / Update Software