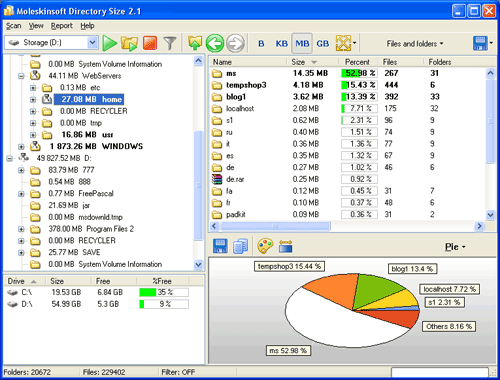
Visual disk usage Screenshot

Why do you need disk space usage analysis? Certainly you asked this question to yourselves and not once. The answer is obvious it's needed for what the computer is necessary. After all it is not enough to get and use the computer. It's all the same what to get a dog and not to visit the veterinary surgeon. As well as any difficult system the computer requires analysis, the revealing of problems and manage decisions. For performance of all these functions you need a qualitative disk usage visualization manager such as Directory Size.
Why is disk usage visualization? Because there is no any analysis that can exist without visual data presentation. It's all the same what to receive a sheet of paper and huge number of figures and data which decoding will take a lot of time. Disk usage visualization will simplify this process having submitted the data in a convenient graphic kind.
Program Directory Size visual disk usage using bars and pies in which disk space distribution is represented on separate elements (files and folders) proceeding from their share at the rate of the learned directory. The tool is in the bottom right program window. Having received the graphic you can give a pleasant (in your opinion) kind to it. For this purpose in the program the change of gradient background and colour palette is accessible. Having chosen colours you'll give a unique kind to your graphic.
Directory Size visual disk usage so that it was convenient. The received result can be saved in a separate BMP file or copied to clipboard. Further it is possible to return to the saved results and use them for various purposes. For example not to repeat the analysis constantly and to receive ready information.
Back to Visual disk usage Details page
- Disk Usage Report
- Disk Usage On Windows
- Monitor Disk Usage
- Examine Disk Usage
- Disk Usage Freeware
- Freeware Disk Usage
- Analyse Disk Usage
- Disk Usage Tool
- Disk Usage Graph
- Disk Usage Ipad
