Free Downloads: Charts And Graphs
 Shareware
FusionCharts for Flex is a charting component for Adobe Flex solutions. It helps you create interactive Charts and Graphs in your Flex projects. The Charts are powered by FusionCharts v3 framework - the industry leader in Adobe Flash Charting. FusionCharts for Flex offers over 45 chart types spanning both 2D and 3D Charts, including: * Standard...
Category: Software Development / Components & Libraries
Publisher: InfoSoft Global (P) Ltd., License: Shareware, Price: USD $299.00, ALL1499, File Size: 14.5 MB
Platform: Windows, Mac, Linux, Unix
Rapid Charts provides the tools you need to help make creating Charts and Graphs for use in web sites or applications as straightforward as possible. Chart definitions allow you to easily save the chart for later use, save the definition to a shared database to share the chart with others or for use in a web page. Charts can be saved to a jpg or png file for...
Category: Audio / Utilities & Plug-Ins
Publisher: LLamedos Software, License: Shareware, Price: USD $14.95, File Size: 4.2 MB
Platform: Windows
mxGraph is a product family of libraries, written in a variety of technologies, that provide features aimed at applications that display interactive diagrams and Graphs. Note by Graphs we mean mathematical Graphs, not necessarily Charts (although some Charts are Graphs). See later section “What is a Graph?” for more details.
Category: Multimedia & Design / Digital Media Editors
Publisher: JGraph Ltd, License: Shareware, Price: USD $0.00, File Size: 0
Platform: Windows
Grab It! is a Microsoft Excel based application that digitizes Graphs or Charts to obtain the original data. Graphs and Charts can have data point values digitized or photos can have angle and distance measurements made. All data is placed directly into Excel for easy re-use. Skewed Graphs are handled automatically (sometimes scanning isn't perfectly straight)...
Category: Business & Finance
Publisher: DataTrend Software Inc, License: Demo, Price: USD $69.95, File Size: 840.1 KB
Platform: Windows

ActiveX/OCX control to draw 2D pie Charts, bar Charts & line Graphs. As well as displaying the Graphs they can be exported to file in gif, png, bmp, jpg or pcx format. Output can be exported as binary data for use with web applications, or copied to the clipboard. A comprehensive selection of properties allow control over colours, fonts, formatting and layout. Pie...
Category: Software Development
Publisher: Chestysoft, License: Demo, Price: USD $60.00, File Size: 976.3 KB
Platform: Windows
Set of Php Classes for creating charts and graphs.
Set of Php Classes for creating Charts and Graphs. It supports more than 18 types (linechart, piechart, barchart, radarchart, curves , gauges, 3D Charts, Candlestick, areacharts) and combinations of them. It includes a richt set of features like labels, notes, tips, multiple axis, logarithmic axis, date axis, pattern fillings, transparencies, stacked axis, stacked...
Category: Web Authoring / Web Design Utilities
Publisher: J4L Components, License: Demo, Price: USD $40.00, File Size: 1.0 MB
Platform: Windows, Linux
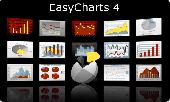
EasyCharts is a complete library of java chart components, chart applets, and chart servlets that enable programmers to add Charts and Graphs in java applications, web applications, and web pages with just a few lines of code. The java chart library includes bar Charts, line Charts, and pie Charts and is highly configurable. The java chart library supports...
Category: Software Development
Publisher: ObjectPlanet, Inc., License: Demo, Price: USD $450.00, File Size: 2.8 MB
Platform: Windows, Mac, Linux, Unix, Java
Grapher is the ultimate technical graphing package available.
Grapher is the ultimate technical graphing package available.
Choose from several specialty graph types, including ternary, box-whisker, bubble plots, pie Charts, and hi-low-close plots.
Wow your audience every time they see your Graphs. Create one of 54 unique graph types.
This easy-to-use, powerful, dynamic program will help you create...
Category: Multimedia & Design / Multimedia App's
Publisher: Golden Software, License: Shareware, Price: USD $0.00, File Size: 34.0 MB
Platform: Windows
This ASP.NET component draws pie and bar Charts and line Graphs "on the fly". Output can be streamed to the browser in GIF or other formats, saved to file or exported to a Bitmap structure. A wide range of properties allow the customisation of colour, size and text style. Built in defaults allow the production of Graphs with only a few lines of code. Show percentages or...
Category: Software Development
Publisher: Chestysoft, License: Demo, Price: USD $60.00, File Size: 579.5 KB
Platform: Windows
The Plot control created to display graphs and charts on .
The Plot control created to display Graphs and Charts on .NET Windows Forms. Advantages of this control are very quick embedding into your application and powerful features. Written using 100% managed code. Also, this control can be used to create animated Graphs. With this control You can: draw lines just from arrays, use gradients to fill lines colors, draw histograms...
Category: Software Development / Components & Libraries
Publisher: Advanced Software Solutions, License: Shareware, Price: USD $19.00, File Size: 1.1 MB
Platform: Windows
Demo
This COM object / ASP component draws pie and bar Charts and line Graphs on the fly. Output can be streamed to the browser using BinaryWrite, or saved to file. Image types include GIF, PNG, JPG and bitmap. A wide range of properties allow the customisation of colour, size and text style. Built in defaults allow the production of Graphs with only a few lines of code. Show...
Category: Web Authoring / Scripts & CGI Tools
Publisher: Chestysoft, License: Demo, Price: USD $60.00, File Size: 594.9 KB
Platform: Windows
3D Graphs & Charts is a series of Charting components which can be used bothin intranet and internet web pages. The comprehensive documentation clearlydemonstrates how to implement each component. With the examples (which include documented html code) you will quicklybe able to incorporate these powerful components into your own pages.
Category: Internet / Tools & Utilities
Publisher: Sirius Computer Consultants Limited, License: Demo, Price: USD $30.00, File Size: 130.0 KB
Platform: Windows
Graph Digitizer Scout automatically converts hard-copy Graphs, oscillograms, Charts, plots, into X,Y. Different recognition methods including manual correction mode. Data can be exported to Excel, CSV format and other applications.
Category: Home & Education / Mathematics
Publisher: ByteScout, License: Demo, Price: USD $35.00, File Size: 5.2 MB
Platform: Windows
Web Enabled solution for creating Stacked Horizontal Charts & Graphs.
Web Enabled solution for creating Stacked Horizontal Charts & Graphs. Versatile components for web authors and developers to easily build and publish dynamic and interactive bar Graphs. Database Access Methods (Direct Data Binding and Multi-Tier)Template Scripts and Implementations (ASP, JSP, PHP and Servlet Code)Documentation, Demo Implementations and Tutorial...
Category: Software Development / Tools & Editors
Publisher: Sirius Computer Consultants Limited, License: Shareware, Price: USD $49.95, File Size: 252.0 KB
Platform: Windows
Add Powerful reporting features to your Web / Intranet pages and applications. With advanced graphing you will be quickly adding impressive and dynamic charting capabilities bringing your data alive ! The PHP graphing scripts provide a very easy way to embed dynamically generated Graphs and Charts into PHP applications and HTML web pages.Very easy to use and add professional...
Category: Software Development
Publisher: Sirius Computer Consultants Limited, License: Shareware, Price: USD $345.00, File Size: 1.5 MB
Platform: Windows, Mac, Linux, OS/2, Unix
Students use InspireData® to investigate, analyse, and represent data and information in dynamic Graphs and Charts. InspireData tools make it easy to change variables and plot types so students can explore data in multiple, meaningful ways. This encourages them to investigate data analytically, ask more questions, and apply their understanding of the data to form better...
Category: Home & Education / Teaching Tools
Publisher: Inspiration Software, Inc., License: Shareware, Price: USD $79.00, File Size: 30.8 MB
Platform: Windows
DigitizeIt digitizes scanned Graphs and Charts. Graphs can be loaded in nearly all common image formats (incl. gif,tiff,jpeg,bmp,png,psd,pcx,xbm,xpm,tga,pct) or pasted from the clipboard . Digitizing of line and scatter plots occurs automatically, manual digitizing via mouse clicks is also possible. Data values are transformed to a specified axes system and can be saved...
Category: Home & Education
Publisher: Bormisoft, License: Shareware, Price: USD $39.00, File Size: 9.7 MB
Platform: Windows, Linux, Unix, Mac
GraPL is a professional charting engine which produces high-quality Graphs, ideal for publication in journals and magazines, inclusion in other documents or deployment on the Internet in the VML or SVG vector formats as well as conventional images. By simplifying the process of making standard Charts (barcharts, pie Charts, timeseries ...), GraPL makes it easy to create...
Category: Multimedia & Design / Multimedia App's
Publisher: Causeway Graphical Systems Ltd., License: Shareware, Price: USD $72.00, File Size: 5.3 MB
Platform: Windows
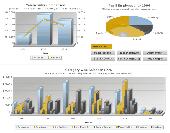
FusionCharts Free is a flash charting component that can be used to render data-driven & animated Charts for your web applications and presentations. It is a cross-browser and cross-platform solution that can be used with ASP.NET, ASP, PHP, JSP, ColdFusion, Ruby on Rails, simple HTML pages or even PowerPoint Presentations to deliver interactive and powerful flash Charts. You...
Category: Software Development
Publisher: InfoSoft Global (P) Ltd., License: Freeware, Price: USD $0.00, File Size: 2.7 MB
Platform: Windows, Mac, Linux,
DPLOT95 is a software for creating and manipulating graphs in 1, 2, 3, and 4-D.
DPLOT95 is a software for creating and manipulating Graphs in 1, 2, 3, and 4-D. With its help you you can create presentation-quality Graphs as well as contour plots of 3-D and 4-D data while using data from a variety of sources. You can use multiple scaling types, including linear, logarithmic, and probability scales on the X and/or Y axes. DPlot also provides several special...
Category: Multimedia & Design / Multimedia App's
Publisher: USAERDC, License: Shareware, Price: USD $195.00, File Size: 9.9 MB
Platform: Windows
The Project Planner reader allows the PPR files to be viewed as Gantt Charts, Network diagrams, Cost / Resource Graphs etc. In order to understand how you and your customers can benefit from the project planner reader and SmartWorks please go through the article on sharing project plans.
Category: Business & Finance / Business Finance
Publisher: Accord Software & Systems Inc., License: Shareware, Price: USD $0.00, File Size: 0
Platform: Windows
Freeware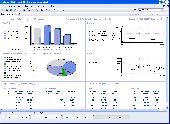
MyOra is a free SQL Tool for Oracle database developers and DBAs. This tool is simple, fast and easy to use, requires no installation, no Oracle client and no internet connection. Just download, unzip and start using with a click of the mouse, run SQL queries and Monitor database performance in Real Time. MyOra’s MDI (Multi Document Interface) framework handles multiple sub-windows opened at...
Category: Software Development / Databases & Networks
Publisher: Jayam Systems, LLC, License: Freeware, Price: USD $0.00, File Size: 1.0 MB
Platform: Windows
TinyGraphs is an open source Excel add-in that creates sparklines, mini column Graphs, and area Graphs from a row of data. It generates beautiful tiny graphics that are as small as a cell and can be placed next to the items that they describe. The tiny graphics, or sparklines, are as tall as the text around them and are useful for visualizing large quantities of data, such as...
Category: Business & Finance / Spreadsheets
Publisher: ConnectCode Pte Ltd, License: Freeware, Price: USD $0.00, File Size: 344.0 KB
Platform: Windows
Fast Statistics is a statistical analysis program for Microsoft Excel.
Fast Statistics is a statistical analysis program for Microsoft Excel. It is can be used as an add-on for it and also it can be installed as a stand-alone application, so there is no need to have MS-Excel installed. It can complete different tasks from manipulations of basic data up to the advanced statistical analysis to produce sophisticated reports and Charts. This tool is perfect for...
Category: Business & Finance / MS Office Addons
Publisher: Fatesoft.com, License: Shareware, Price: USD $49.95, File Size: 3.6 MB
Platform: Windows
Bytescout Graph Digitizer Scout is a handy and useful application that provides users with several functions. This program allows you to convert hard copy Graphs, plots and Charts. This efficient software enables you to digitize Graphs, Charts and plots using automated methods such as luminosity recognition and color recognition. The program works almost...
Category: Multimedia & Design / Multimedia App's
Publisher: ByteScout, License: Shareware, Price: USD $34.45, File Size: 5.2 MB
Platform: Windows