Free Downloads: Graph Plot
Excel Graph Multiple Equations Software is an application that allows you to Plot multiple functions in Microsoft Excel. It is able to create multiple charts based on the formulas entered. You can enter an equation manually or load multiple equations from a text file (.txt). The application is able to Plot each equation on an individual Graph or all the equations on...
Category: Business & Finance / MS Office Addons
Publisher: Sobolsoft, License: Shareware, Price: USD $19.99, File Size: 2.5 MB
Platform: Windows
MathTrax is a graphing tool for middle school and high school students to Graph equations, physics simulations or Plot data files.
The graphs have descriptions and sound so you can hear and read about the Graph. Blind and low vision users can access visual math data and Graph or experiment with equations and datasets.
Category: Business & Finance / Applications
Publisher: The MathTrax Team, License: Freeware, Price: USD $0.00, File Size: 21.0 MB
Platform: Windows
Plot Digitizer is a great piece of software developed by Joseph A.
Plot Digitizer is a great piece of software developed by Joseph A. Huwaldt. The main goal of the program is to extract information from two-dimensional plots or graphs. It is very common to find information the form of a Plot or Graph, showing the relation between two variables. However, this information will not be useful until data is converted to standard x-y values...
Category: Multimedia & Design / Multimedia App's
Publisher: Joseph A. Huwaldt, License: Freeware, Price: USD $0.00, File Size: 4.4 MB
Platform: Windows
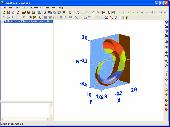
Function Grapher is an easy-to-use software to create 2D, 2.5D, 3D function graphs, animations and table graphs. 2D Features: explicit, implicit, parametric, and in equation; Cartesian and polar coordinate systems; curve and animation; Graph of inverse function and derivative function; parity; maximum, minimum, and inflexion; integration; root; the length of curve; tangent and normal;...
Category: Home & Education / Mathematics
Publisher: GraphNow, License: Shareware, Price: USD $39.95, File Size: 2.9 MB
Platform: Unknown
LiveGraph is a framework for real-time data visualisation, analysis and logging. Distinctive features: - A real-time plotter that can automatically update graphs of your data while it is still being computed by your application. - Concise and simple point-and-click interface that allows to quickly select and compare data series even in applications that output over 1000 series...
Category: Home & Education / Science
Publisher: LiveGraph open-source project, License: Freeware, Price: USD $0.00, File Size: 889.0 KB
Platform: Windows, Mac, Linux
MatheGrafix is an excellent tool that allows you to Plot 2D graphs including linear, geometric, exponential, fractals ones and more. The program operates in two modes: you can introduce the formula and Plot the Graph or you can draw interactively a geometric function on the Graph.
There are two important windows: the "Mode functions" window...
Category: Business & Finance / Applications
Publisher: Roland Hammes, License: Freeware, Price: USD $0.00, File Size: 1.8 MB
Platform: Windows
PSI-Plot brings flexibility to technical plotting and data analysis.
PSI-Plot brings flexibility to technical plotting and data analysis. It has a powerful scientific spreadsheet for data analysis, and an object-oriented on screen graphics editor that makes it easy to design and modify graphs. The powerful features combine with the intuitive and user friendly interface have made PSI-Plot one of the most popular data analysis and graphing program....
Category: Multimedia & Design / Multimedia App's
Publisher: Poly Software International, Inc., License: Shareware, Price: USD $0.00, File Size: 0
Platform: Windows
Rt-Plot is a tool to generate Cartesian X/Y-plots from scientific data.
Rt-Plot is a tool to generate Cartesian X/Y-plots from scientific data. You can enter and calculate tabular data. View the changing graphs, including linear and non linear regression, interpolation, differentiation and integration, during entering. Rt-Plot enables you to create plots fast and easily. The line calculations give full access to calculation and display ranges and can...
Category: Home & Education / Mathematics
Publisher: Rt-Science, License: Shareware, Price: USD $29.90, File Size: 5.2 MB
Platform: Windows
RJS Graph produces professional scientific and mathematical graphs.
RJS Graph produces professional scientific and mathematical graphs. You may study the data with a wide range of data analysis tools. Features include the ability to Plot data and equations, fit best fit curves and splines, and display fitted best fit curve parameters. Data can be pasted from a spreadsheet or imported from a text file using a wizard.
Category: Home & Education / Mathematics
Publisher: RJS, License: Freeware, Price: USD $0.00, File Size: 3.7 MB
Platform: Windows
Visually build your story as your ideas come to you.
Visually build your story as your ideas come to you. Strategically place novel chapters, screenplay scenes and subplots on a three act excitement Graph to construct your story. There are no constraints of a structured formula. Just use the excitement Graph to guide your scene assembly as you write your story in standard format.
Category: Multimedia & Design / Multimedia App's
Publisher: Wilsibs, LLC, License: Shareware, Price: USD $19.00, File Size: 456.0 KB
Platform: Windows
With this interesting fractal software, you can use Newton's method to solve a complex equation and show the fractal Graph in the Plot area. Mandelbrot set and Julia set can also be plotted. Graphs created can be saved as bmp files. With this interesting fractal software, you can use Newton's method to solve a complex equation and show the fractal Graph in the Plot...
Category: Home & Education / Mathematics
Publisher: GraphNow, License: Demo, Price: USD $30.00, File Size: 1.3 MB
Platform: Windows
 Demo
Demo
Imagine a complete Graphing solution assisting you right from importing data and manipulating data, plotting graphs, customizing looks, saving and exporting your graphs as high quality images and producing dynamic reports of your data in a matter of a few easy steps. Features: Data Import: Connects effortlessly with your MS SQL Server, Oracle, Access, XLS and CSV files and additionally...
Category: Software Development / Databases & Networks
Publisher: Teknowledge LLC, License: Demo, Price: USD $99.00, File Size: 8.1 MB
Platform: Windows
Cumulative Probability Plot does all of the statistical mathematics for you and outputs the data in a visual format that can be easily interpreted by people with a limited knowledge of statistics.
The Graph is also useful for a quick demonstration to regulators or other interested parties that your product or process is within acceptable tolerance or meets regulatory...
Category: Multimedia & Design / Multimedia App's
Publisher: Rad Pro Calculator, License: Freeware, Price: USD $0.00, File Size: 8.8 MB
Platform: Windows
Rt-Tools2D is a selection of components to generate two dimensional Cartesian plots: *TRtCaptionEdit: This is a special edit control supporting enhanced styles as bold, italic, underline, strikeout, subscript, superscript and symbol font. This is especially interesting to alter TRtLabels which supports the same styles. *TRtLabel: Label supporting enhanced styles as bold, italic, underline,...
Category: Software Development
Publisher: Rt-Science, License: Shareware, Price: USD $140.00, File Size: 6.3 MB
Platform: Windows
Archimedes Grapher is a kind of powerful and convenient tool software which supports functional Graph plotting, numerical calculation, unit conversion, and slide show. It can Plot all kinds of graphs (functional graphs, table graphs, polar equation, parameter equation, inequation and etc.), implement all kinds of calculations (multivariable scientific calculation, generating...
Category: Home & Education / Miscellaneous
Publisher: NewXor Software,Inc, License: Shareware, Price: USD $28.00, File Size: 2.1 MB
Platform: Windows

Obtain data from images of graphs scanned from articles or available as image. Import the Graph into ScanIt from a scanner or file, or from the clipboard. Define locations of the Graph's axes by indicating known points. Extract data from the Graph by manually picking points, by scanning for points or by scanning along curves. Copy the scanned data to Excel or export data to...
Category: Home & Education / Science
Publisher: amsterchem, License: Freeware, Price: USD $0.00, File Size: 6.1 MB
Platform: Windows
Create your own custom sheets of Graph paper. You have complete control over the Graph characteristics. X and Y axis can independently be set for linear or log scale. Selection from a dozen standard paper sizes, or custom create your own. Graphs saved as pdf files you can print them whenever you wish. Choose whatever color you want for the lines. Specify independent line weights...
Category: Home & Education
Publisher: Black Cat Systems, License: Shareware, Price: USD $19.99, File Size: 1.4 MB
Platform: Windows
Graph Studio is the open source graph drawing/processing software.
Graph Studio is the open source Graph drawing/processing software. It allows users to build and process highly customizable graphs.
Category: Multimedia & Design
Publisher: sourceforge.net, License: Freeware, Price: USD $0.00, File Size: 118.0 KB
Platform: Windows, Mac, Vista
GraphSight Junior is an easy to use freeware handy 2D math-graphing program.
GraphSight Junior is an easy to use freeware handy 2D math-graphing program. It was originally designed to help students and teachers satisfy their day-after-day math plotting needs. It makes it easy to Plot and explore common Y(X) = F(X) Cartesian graphs, set text labels on the coordinate plane, zoom or shift a Graph with just a single click & move of mouse. The resulting...
Category: Home & Education / Miscellaneous
Publisher: CradleFields.com, License: Freeware, Price: USD $0.00, File Size: 393.0 KB
Platform: Windows
Chart java applet software to generate dynamic charts and graphs - bar, line, pie, stacked and grouped charts in 2D and 3D with a wide range of parameters and chart types. Main features: Charts in 2D/3D, Anti aliasing, Multi language support, Cross browser compatible, Java Script parameter control, Data labels, Contextual data drill down, CSV data sources, Trend calculation, 3D depth control,...
Category: Software Development / Tools & Editors
Publisher: Swiftchart Limited, License: Demo, Price: USD $99.00, File Size: 97.0 KB
Platform: Windows, Mac, Linux, Unix, MS-DOS, AS, 400

Chart java applet software to generate dynamic charts and graphs - bar, line, pie, stacked and grouped charts in 2D and 3D with a wide range of parameters and chart types. Main features: Charts in 2D/3D, Anti aliasing, Multi language support, Cross browser compatible, Java Script parameter control, Data labels, Contextual data drill down, CSV data sources, Trend calculation, 3D depth control,...
Category: Multimedia & Design
Publisher: Swiftchart Limited, License: Demo, Price: USD $99.00, File Size: 97.7 KB
Platform: Windows, Mac, Linux, Unix, MS-DOS, AS/400
HOBOware data logging software lets you view, Graph and analyze data with point-and-click simplicity. You can easily setup your application in a matter of minutes, quickly readout and Plot data, and export to spreadsheets for further analysis.
Features of HOBOware Pro Data Logging Software:
Presentation quality graphics
Powerful Analysis
Alarm...
Category: Multimedia & Design / Digital Media Editors
Publisher: Onset Computer Corporation, License: Shareware, Price: USD $84.00, File Size: 101.0 MB
Platform: Windows
The Plot control created to display graphs and charts on .
The Plot control created to display graphs and charts on .NET Windows Forms. Advantages of this control are very quick embedding into your application and powerful features. Written using 100% managed code. Also, this control can be used to create animated graphs. With this control You can: draw lines just from arrays, use gradients to fill lines colors, draw histograms just by passing...
Category: Software Development / Components & Libraries
Publisher: Advanced Software Solutions, License: Shareware, Price: USD $19.00, File Size: 1.1 MB
Platform: Windows
If you are searching for a computer program that can Plot simple graphs on your PC, GraphSight Junior is what you are looking for. This utility is feature rich and comprehensive. It plots 2D graphs with easy navigation, and it’s well suited for high school and college math students.
It can Plot Cartesian, polar, table defined, as well as specialty graphs, such as...
Category: Home & Education / Mathematics
Publisher: CradleFields.com, License: Freeware, Price: USD $0.00, File Size: 417.5 KB
Platform: Windows
Graph constructs, visualizes and modifies graphs as well as calculates measures and layouts.
Graph constructs, visualizes and modifies graphs as well as calculates measures and layouts.
CoSBiLab Graph can construct, visualize and modify graphs as well as calculate measures and layouts. CoSBiLab Graph can import and export data in a variety of formats, among which the reaction network generated by the beta WorkBench.
Category: Multimedia & Design / Multimedia App's
Publisher: CoSBi, License: Freeware, Price: USD $0.00, File Size: 3.1 MB
Platform: Windows