Free Downloads: Plot Data Soft
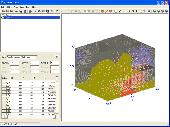
For use with VIA Echo network analyzer instruments, all models.
For use with VIA Echo network analyzer instruments, all models.Reading Data from any source (Echo live, Echo’s memory, or PC file) will Plot the Data onto all the appropriate charts, not just the chart being viewed.
You can now change chart tabs and see the Data in a different formats (VIA Plot, Smith Chart, SWR Plot, etc.) without...
Category: Internet / Monitoring
Publisher: AEA Technology, Inc., License: Shareware, Price: USD $0.00, File Size: 5.8 MB
Platform: Windows
Real contour plots are created in Excel.
Real contour plots are created in Excel. You can interact with the contour Plot just like any other Excel Plot.
Contour Plot works with any contour Data. It accommodates rectangular Data, nearly rectangular Data, and irregular Data. It includes a Data generator for polynomials or any equation.
Category: Business & Finance / MS Office Addons
Publisher: Office Expander, License: Shareware, Price: USD $70.00, File Size: 696.1 KB
Platform: Windows
PSI-Plot brings flexibility to technical plotting and data analysis.
PSI-Plot brings flexibility to technical plotting and Data analysis. It has a powerful scientific spreadsheet for Data analysis, and an object-oriented on screen graphics editor that makes it easy to design and modify graphs. The powerful features combine with the intuitive and user friendly interface have made PSI-Plot one of the most popular Data analysis...
Category: Multimedia & Design / Multimedia App's
Publisher: Poly Software International, Inc., License: Shareware, Price: USD $0.00, File Size: 0
Platform: Windows
User can paint individual lines by dragging the cursor over lines and identify data interactively.
User can paint individual lines by dragging the cursor over lines and identify Data interactively.
In this version of Data Paint you have interactive Rotating Scatter Plot, Simple Scatter Plot, Bar Chart, Star Plot and Parallel Coordinate Plot.
This software can be customized for a specific need.
Category: Business & Finance / Business Finance
Publisher: Man Machine Interface, Inc, License: Freeware, Price: USD $0.00, File Size: 2.4 MB
Platform: Windows
The primary purpose of XL-Plot is to create a figure rapidly.
The primary purpose of XL-Plot is to create a figure rapidly. It is ideal for for use at high school, as the path from Data in one or more spreadsheet columns to the final figure is short (just a few mouse clicks) and easy to grasp. It contains basic stat
Category: Home & Education / Mathematics
Publisher: bram.org, License: Freeware, Price: USD $0.00, File Size: 2.0 MB
Platform: Windows
Zaitun Time Series is software designed for statistical analysis of time series data.
Zaitun Time Series is software designed for statistical analysis of time series Data. It provides easy way for time series modeling and forecasting.
Zaitun Time Series provides several statistics and neural networks models, and graphical tools that will make your work on time series analysis easier.
Statistics dan Neural Networks Analysis: Trend Analysis, Decomposition, Moving...
Category: Home & Education / Mathematics
Publisher: Zaitun Software, License: Freeware, Price: USD $0.00, File Size: 1.0 MB
Platform: Windows
Creating graphs of regular Data and irregular Data. Creating vertex, grid and surface model, Delaunay triangles, color map, contour Plot, vector Plot, 3D contour Plot, 4D scatter, 4D slice and 4D vector.
Category: Home & Education / Science
Publisher: GraphNow, License: Shareware, Price: USD $59.95, File Size: 2.6 MB
Platform: Unknown
Operates in English (I-P) or metric (SI) units.
Operates in English (I-P) or metric (SI) units.
Create high quality, customized psychrometric charts.
Plot your process Data with state point labels.
Print a report of state points and processes.
Add notes and annotations.
Define and Plot zones on your charts, (e.g. comfort zones)
Copy/paste charts to your presentation or word processing...
Category: Multimedia & Design / Digital Media Editors
Publisher: Linric Company, License: Shareware, Price: USD $149.95, File Size: 20.2 MB
Platform: Windows
Plot Digitizer is a great piece of software developed by Joseph A.
Plot Digitizer is a great piece of software developed by Joseph A. Huwaldt. The main goal of the program is to extract information from two-dimensional plots or graphs. It is very common to find information the form of a Plot or graph, showing the relation between two variables. However, this information will not be useful until Data is converted to standard x-y values...
Category: Multimedia & Design / Multimedia App's
Publisher: Joseph A. Huwaldt, License: Freeware, Price: USD $0.00, File Size: 4.4 MB
Platform: Windows
The Plot control created to display graphs and charts on .
The Plot control created to display graphs and charts on .NET Windows Forms. Advantages of this control are very quick embedding into your application and powerful features. Written using 100% managed code. Also, this control can be used to create animated graphs. With this control You can: draw lines just from arrays, use gradients to fill lines colors, draw histograms just by passing...
Category: Software Development / Components & Libraries
Publisher: Advanced Software Solutions, License: Shareware, Price: USD $19.00, File Size: 1.1 MB
Platform: Windows
Panoply is a Java application which enables the user to Plot raster images of geo-gridded Data from netCDF datasets. Panoply is an utility that enable user to Plot raster image. Depending on the Data, it can draw global longitude-latitude images or pole-t
Category: Multimedia & Design / Illustration
Publisher: giss.nasa.gov, License: Freeware, Price: USD $0.00, File Size: 9.4 MB
Platform: Windows, Mac, 2K, 2K3, Vista
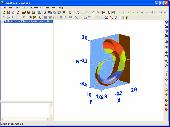
Function Grapher is an easy-to-use software to create 2D, 2.5D, 3D function graphs, animations and table graphs. 2D Features: explicit, implicit, parametric, and in equation; Cartesian and polar coordinate systems; curve and animation; graph of inverse function and derivative function; parity; maximum, minimum, and inflexion; integration; root; the length of curve; tangent and normal; curvature...
Category: Home & Education / Mathematics
Publisher: GraphNow, License: Shareware, Price: USD $39.95, File Size: 2.9 MB
Platform: Unknown
Soft.Bario Community Toolbar — stay connected and get so much more.
Features:
- customizable settings;
- use powerful search engines;
- receive and read your emails with the email notifier;
- useful links;
- listen to your favorite radio station;
- pop-up blocker.
Category: Internet / Browser Accessories
Publisher: Soft.Bario, License: Shareware, Price: USD $0.00, File Size: 0
Platform: Windows
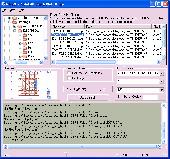
KEW LOG Soft features :
- Displayed message, when no data is saved, is changed to "No data found".
KEW LOG Soft features :
- Displayed message, when no Data is saved, is changed to "No Data found".
- Titles at header part on text sheet in Simplified Power Integration mode, such as "Current", "No.1", are changed.
- At the setting for Power Quality Recording, ranges other than for Voltage sensor aren't selectale.
Category: Audio / Utilities & Plug-Ins
Publisher: KYORITSU ELECTRICAL INSTRUMENTS WORKS,LTD., License: Freeware, Price: USD $0.00, File Size: 11.3 MB
Platform: Windows
Cumulative Probability Plot does all of the statistical mathematics for you and outputs the Data in a visual format that can be easily interpreted by people with a limited knowledge of statistics.
The graph is also useful for a quick demonstration to regulators or other interested parties that your product or process is within acceptable tolerance or meets regulatory...
Category: Multimedia & Design / Multimedia App's
Publisher: Rad Pro Calculator, License: Freeware, Price: USD $0.00, File Size: 8.8 MB
Platform: Windows
LiveGraph is a framework for real-time Data visualisation, analysis and logging. Distinctive features: - A real-time plotter that can automatically update graphs of your Data while it is still being computed by your application. - Concise and simple point-and-click interface that allows to quickly select and compare Data series even in applications that output...
Category: Home & Education / Science
Publisher: LiveGraph open-source project, License: Freeware, Price: USD $0.00, File Size: 889.0 KB
Platform: Windows, Mac, Linux
Are you tired of printing drawings? well! we have a solution for you. What is plot2k? plot2k is AutoCAD Batch Plot Utility which can open and print AutoCAD drawings in Batch mode. Plot2k is a 32 bit utility designed to open and print AutoCAD drawings in batch mode. with batch Plot drawings you can print either all of your drawings or selected drawings in one go. Plot2k is featured...
Category: Multimedia & Design
Publisher: PLot2k, License: Shareware, Price: USD $39.95, File Size: 968.0 KB
Platform: Windows
 Freeware
SimplexNumerica is an object-oriented numerical Data analyzer, Plot and presentation program. SimplexNumerica is proving to be extremely popular among scientists. Ergonomic programming using the newest Windows programming guidelines with toolbars, context dialogs and interactive diagrams providing easy handling with difficult numeric mathematics. SimplexNumerica is best suited for...
Category: Home & Education / Mathematics
Publisher: Dipl.-Phys.-Ing. Ralf Wirtz, License: Freeware, Price: USD $0.00, File Size: 21.8 MB
Platform: Windows
MeExplorer offers the user a series of new features some of which are: double markers, time vawe function Plot, new graphic that will give multiple FFT Plot in the next year and others. MeExplorer makes Data base handling much faster that before. The upgrade is valid for all new versions for one year.
Category: Multimedia & Design / Multimedia App's
Publisher: Vibrationsteknik AB, License: Demo, Price: USD $0.00, File Size: 89.0 MB
Platform: Windows
Gnuplot.py is a Python package that interfaces to gnuplot, the popular open-source plotting program. It allows you to use gnuplot from within Python to Plot arrays of Data from memory, Data files, or mathematical functions. If you use Python to perform computations or as 'glue' for numerical programs, you can use this package to Plot Data on the fly...
Category: Multimedia & Design / Multimedia App's
Publisher: pythonxy.com, License: Freeware, Price: USD $0.00, File Size: 193.3 KB
Platform: Windows
This application can be used to visualize a cobweb plot of a function.
This application can be used to visualize a cobweb Plot of a function. The software has been developed using Java language for easy deployment over the web and for easy accessing on all computers you want to use this program. The interface is a Java based style which makes it easy to use.
Category: Multimedia & Design / Multimedia App's
Publisher: Department of Mathematical Sciences - Ball State University, License: Freeware, Price: USD $0.00, File Size: 816 B
Platform: Windows
PLT Export for SolidWorks is a HPGL Plot PLT file export add-in for SolidWorks®. This add-in gives SolidWorks the ability to export geometric Data from a SolidWorks drawing document to a HPGL PLT file. PLT Export for SolidWorks reads curve Data from a SolidWorks drawing document and converts it into corresponding pen movements in a HPGL Plot file. PLT Export...
Category: Multimedia & Design
Publisher: SYCODE, License: Commercial, Price: USD $195.00, File Size: 1.1 MB
Platform: Windows
Shareware
Soft Shines 3D it a screensaver which will relax you with soft shines on your screen. It also an animated wallpaper which will animate your desktop wallpaper with effect of beautiful soft shines.
Category: Desktop Enhancements / Screensavers
Publisher: PUSH Entertainment, License: Shareware, Price: USD $12.95, File Size: 757.6 KB
Platform: Windows
PlotManager, PlotConverter and PlotViewer in one program!
PlotManager, PlotConverter and PlotViewer in one program! The PlotManager is a program for the output, conversion and viewing of Plot files in the HP-GL, HP-GL/2 and HP-RTL format. The output of Plot files is possible even on plotters and printers that don't support the HP-GL protocol! In addition, you can send Plot files directly to a plotter with this program, the files...
Category: Multimedia & Design
Publisher: Software Entwicklung Ralph Meinel, License: Shareware, Price: USD $98.00, File Size: 4.2 MB
Platform: Windows
GeoFryPlots performs strain analyses using the Fry point-to-point method.
GeoFryPlots performs strain analyses using the Fry point-to-point method. Data can be either read in from an ascii file (as pairs of x,y coordinates) or can be digitised directly into a Data window using the mouse. Bitmap images to be digitised can be loaded into the Data window from file. Fry plots are displayed in a separate FryPlot window within which a best-fit strain...
Category: Business & Finance / Applications
Publisher: Rod Holcombe, License: Freeware, Price: USD $0.00, File Size: 2.4 MB
Platform: Windows