Free Downloads: Spreadsheet Stock Chart
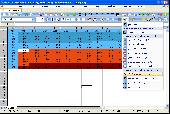
This is a free Spreadsheet that downloads free historical Stock data from the Yahoo database and calculates the historical (realized) volatility of the selected Stock. The standard deviation of prices are plotted along side the Stock price Chart.
Category: Business & Finance / Business Finance
Publisher: optiontradingtips.com, License: Freeware, Price: USD $0.00, File Size: 70.3 KB
Platform: Windows, Mac, 2K, 2K3, Vista
Have you ever seen a Stock Chart and wondered what made the Stock shoot up like a rocket or drop like a rock? Stock Spy is unlike any other Stock Chart because it helps explain what you're seeing. It clearly displays the news and company events which cause the price movements - directly on the Chart. Stock Spy shows you relationship the...
Category: Business & Finance / Project Management
Publisher: Stock RSS News Alerts, License: Demo, Price: USD $39.95, File Size: 3.2 MB
Platform: Windows
 Shareware
CharTTool is an advanced Stock charting software that instantly allows you to display several technical charts of stocks, mutual funds or indices. Intraday and end-of-day Stock charting is available. The list of technical indicators includes Bollinger bands, price channels, moving averages, fast and slow stochastic oscillators, relative strength index, MACD, trading volume and...
Category: Business & Finance / Business Finance
Publisher: Ashkon Technology LLC, License: Shareware, Price: USD $39.95, File Size: 1.1 MB
Platform: Windows, Other
Excel Spreadsheet contains the famed "Fed Valuation Model," a method of Stock market valuation that has long been used by the Federal Reserve Board of Governors to measure Stock market over- or under-valuation. Easily analyze up to ten quarters of market performance at a time. Just enter the report date and a presentation-quality report and Chart are...
Category: Business & Finance / Personal Finance
Publisher: The Spreadsheet Store, License: Commercial, Price: USD $29.95, File Size: 87.0 KB
Platform: Windows
Stock Chart Wizard downloads freely available Stock market data on individual stocks and displays technical charts and indicators. You enter in the Stock tickers you wish to
analyze, and within seconds, line or bar charts are displayed along with selected moving averages and indicators.
Category: Business & Finance / MS Office Addons
Publisher: stockchartwizard.com, License: Shareware, Price: USD $19.00, File Size: 0
Platform: Windows
Shareware
Ashkon Stock Watch is an advanced charting software for financial market information. Unlike a conventional financial website it allows to display several technical indicators for a single security on the same Chart, open multiple Chart documents, maintain predefined lists of securities and test your own investment strategies. Ashkon Stock Watch has several built in...
Category: Business & Finance / Business Finance
Publisher: Ashkon Technology LLC, License: Shareware, Price: USD $95.00, File Size: 3.4 MB
Platform: Windows, Other
Shareware
XML Flash charts are easy to make using Animated Chart Pro. Create dynamic web Chart with live data permanently updated from XML source. Animated Chart Pro edition generates real time web charts using dynamic data and all you have to do is to customize Chart appearance, get the result and embed an interactive dynamic flash Chart into your Web page. Flash...
Category: Web Authoring / Website Animation Tools
Publisher: Flarium, License: Shareware, Price: USD $69.00, File Size: 2.7 MB
Platform: Windows
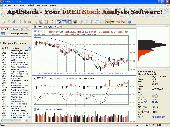
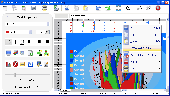
AptiStock is the FREE stock market analysis software developed for every level of trader.
AptiStock is the FREE Stock market analysis software developed for every level of trader. The basic intention of AptiStock is to allow everyone to use technical analysis software without the needs to buy an expensive tool. It is ideal for the novices who are passionate in Stock market and it also has a short learning curve of less than 30 minutes. It helps traders to be more...
Category: Business & Finance
Publisher: AptiStock, License: Freeware, Price: USD $0.00, File Size: 3.8 MB
Platform: Windows
Freeware
Create a portfolio with this Spreadsheet for Excel 97 or better. Enter your past and present Stock holdings. See your gains and losses at a glance. Get on-line quotes from: Toronto (Yahoo), Yahoo India, Yahoo Hong Kong, Yahoo Deutschland
Category: Business & Finance / Personal Finance
Publisher: Breaktru Software, License: Freeware, Price: USD $0.00, File Size: 3.7 MB
Platform: Windows
MistyChartNet is a .NET based charting component. MistyChartNet supports about 50 Chart formats. Some of the Chart formats supported are pie, column, 3d column, Stock, etc. MistyChartNet allows displaying any of the supported Chart types using the popup menu.MistyChartNet can be customized at design time in Microsoft Visual Studio .NET 2003 and above.
Category: Software Development / Components & Libraries
Publisher: MITS, License: Shareware, Price: USD $500.00, File Size: 266.2 KB
Platform: Unknown
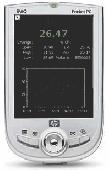
Stock Quotes for Pocket PC is an easy-to-use application for modern mobile platform. It allows you to monitor Stock quotes information provided by Yahoo in real time. Besides, you can view news relevant to the selected Stock, set customizable alerts, search for ticker and get company summary information by its Stock symbol. Stock Quotes for Pocket PC consists...
Category: Business & Finance
Publisher: OLSOFT, License: Shareware, Price: USD $9.95, File Size: 3.2 MB
Platform:
DAXA-Chart Privat is a freeware German program for analyzing and charting shares and portfolio management. Powerful yet easy to use, it is supplied with an initial database of 120 German stocks. Download further stockmarket price updates from our homepage for free.
Category: Business & Finance
Publisher: Vermögensberatung Martin Iwersen, License: Freeware, Price: USD $0.00, File Size: 1.1 MB
Platform: Windows
MistyChart is a java based charting component. MistyChart requires java Plug-in 1.4. MistyChart supports close to 50 Chart formats. Some of the Chart formats supported are pie, column, 3d column, Stock, etc. MistyChart allows displaying any of the supported Chart types using the popup menu.MistyChart can be customized at design time using the rich API set provided.
Category: Software Development / Components & Libraries
Publisher: MITS, License: Shareware, Price: USD $400.00, File Size: 194.6 KB
Platform: Unknown

Chart java applet software to generate dynamic charts and graphs - bar, line, pie, stacked and grouped charts in 2D and 3D with a wide range of parameters and Chart types. Main features: Charts in 2D/3D, Anti aliasing, Multi language support, Cross browser compatible, Java Script parameter control, Data labels, Contextual data drill down, CSV data sources, Trend calculation, 3D...
Category: Multimedia & Design
Publisher: Swiftchart Limited, License: Demo, Price: USD $99.00, File Size: 97.7 KB
Platform: Windows, Mac, Linux, Unix, MS-DOS, AS/400
Create a portfolio with this Spreadsheet for Excel 97 or better. Enter your past and present Stock holdings. See your gains and losses at a glance. Get on-line quotes from: CNN.com, Quicken.com, Quote.com, NASDAQ.com, PC Quote.com, Toronto (TSX), Yahoo India, Yahoo Hong Kong, Yahoo Deutschland
Category: Home & Education
Publisher: Breaktru Software, License: Freeware, Price: USD $0.00, File Size: 654.3 KB
Platform: Windows
Chart java applet software to generate dynamic charts and graphs - bar, line, pie, stacked and grouped charts in 2D and 3D with a wide range of parameters and Chart types. Main features: Charts in 2D/3D, Anti aliasing, Multi language support, Cross browser compatible, Java Script parameter control, Data labels, Contextual data drill down, CSV data sources, Trend calculation, 3D...
Category: Software Development / Tools & Editors
Publisher: Swiftchart Limited, License: Demo, Price: USD $99.00, File Size: 97.0 KB
Platform: Windows, Mac, Linux, Unix, MS-DOS, AS, 400
Freeware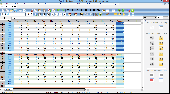
Accel is a very useful Spreadsheet application for everyday use at home or the office. This powerful Spreadsheet has all the tools you need to calculate, analyse, summarise, and present your data in numerical reports or colourful graphics. A fully-integrated help system makes entering complex formulas a breeze. Pull in external data using ODBC, sort it, and produce subtotals...
Category: Business & Finance / Spreadsheets
Publisher: SSuite Office Software, License: Freeware, Price: USD $0.00, File Size: 22.9 MB
Platform: Windows

Chart java applet software to generate dynamic charts and graphs within JSP, servlets or java applications - bar, line, pie, stacked and grouped charts in 2D and 3D with a wide range of parameters and Chart types. Main features: Charts in 2D/3D, Anti aliasing, Multi language support, Cross browser compatible, Java Script parameter control, Data labels, Contextual data drill down,...
Category: Software Development
Publisher: Swiftchart Limited, License: Demo, Price: USD $99.00, File Size: 97.7 KB
Platform: Windows, Mac, Linux, Unix, MS-DOS, AS/400
Chart java applet software to generate dynamic charts and graphs within JSP, servlets or java applications - bar, line, pie, stacked and grouped charts in 2D and 3D with a wide range of parameters and Chart types. Main features: Charts in 2D/3D, Anti aliasing, Multi language support, Cross browser compatible, Java Script parameter control, Data labels, Contextual data drill down,...
Category: Software Development / Tools & Editors
Publisher: Swiftchart Limited, License: Demo, Price: USD $99.00, File Size: 97.0 KB
Platform: Windows, Mac, Linux, Unix, MS-DOS, AS, 400
Accel is a very useful Spreadsheet application for everyday use at home or the office. This powerful Spreadsheet has all the tools you need to calculate, analyse, summarise, and present your data in numerical reports or colourful graphics. A fully-integrated help system makes entering complex formulas a breeze. Pull in external data using ODBC, sort it, and produce subtotals...
Category: Business & Finance / Spreadsheets
Publisher: SSuite Office Software, License: Freeware, Price: USD $0.00, File Size: 17.8 MB
Platform: Windows
Demo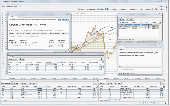
Stockdance is an easy to use Stock investing software for individual investors analyzing companies based on their fundamentals. With Stockdance you can analyze historical financial data series of a company in a powerful analysis Chart and compare the data series with competitors or market indexes. Rate each company based on your Stock selection criterion to select only...
Category: Business & Finance / Business Finance
Publisher: The Green Meadow Company, License: Demo, Price: USD $26.00, File Size: 81.6 MB
Platform: Windows
QT Calc Express is a very useful and small Spreadsheet application for everyday use at home or for students and scholars needing something small, fast, and easy to use. This small yet powerful Spreadsheet has all the tools you need to calculate, analyse, summarise, and present your data in numerical reports or colourful graphics. A fully-integrated help system makes...
Category: Business & Finance / Applications
Publisher: SSuite Office Software, License: Freeware, Price: USD $0.00, File Size: 5.1 MB
Platform: Windows
Stock Quotes for Excel is a powerfull Add-in for Excel that allows you to update Stock Quotes automatically, Market Indexes and Mutual Funds into your Excel spreadsheets - via Internet. No more manual and tedious updates. No more risk of using outdated data. It seamlessly integrates to Microsoft Excel with functions that allow you to intuitively enter parameters, and query online...
Category: Business & Finance / MS Office Addons
Publisher: Model Advisor, License: Shareware, Price: USD $99.95, File Size: 4.0 MB
Platform: Windows
Shareware
Stock Sector Monitor is a personal desktop financial application that allows you instantly monitor over 200 Stock industry sector groups and over 7000 public companies online. With Stock Sector Monitor you easily can find daily top gaining and losing stocks in each Stock sector, watch quotes, percentage change, volume and other quotes information, print reports,...
Category: Business & Finance / Personal Finance
Publisher: Ashkon Technology LLC, License: Shareware, Price: USD $49.95, EUR44.95, File Size: 774.4 KB
Platform: Windows
Parity Plus is one of the most powerful Stock Charting and Technical Analysis Programs available on the market. Parity includes over 50 of the most popular indicators for the technical analysis of stocks and commodities. The majority of these indicators act as functions that return an array, which can be used as the input to another indicator or within a user defined formula. This makes...
Category: Business & Finance / Project Management
Publisher: DITEC International, License: Shareware, Price: USD $122.00, File Size: 634.9 KB
Platform: Windows