Free Downloads: Statistic Graph Software
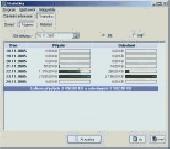
Network statistic and monitoring, flow window,export statistic to html and excel
Network Statistic and monitoring, flow window, export Statistic to html and excel
Category: Internet
Publisher: Martin Matousek, License: Freeware, Price: USD $0.00, File Size: 2.2 MB
Platform: Windows
Network statistic and monitoring, flow window, export statistic to html and excel. .
Network statistic and monitoring, flow window, export statistic to html and excel
Category: Internet / Monitoring
Publisher: Martin Matousek, License: Freeware, Price: USD $0.00, File Size: 2.2 MB
Platform: Windows
Graph Studio is the open source graph drawing/processing software.
Graph Studio is the open source Graph drawing/processing Software. It allows users to build and process highly customizable graphs.
Category: Multimedia & Design
Publisher: sourceforge.net, License: Freeware, Price: USD $0.00, File Size: 118.0 KB
Platform: Windows, Mac, Vista
Create your own custom sheets of Graph paper. You have complete control over the Graph characteristics. X and Y axis can independently be set for linear or log scale. Selection from a dozen standard paper sizes, or custom create your own. Graphs saved as pdf files you can print them whenever you wish. Choose whatever color you want for the lines. Specify independent line weights...
Category: Home & Education
Publisher: Black Cat Systems, License: Shareware, Price: USD $19.99, File Size: 1.4 MB
Platform: Windows
LottoGear gives you more functions than you can expect.
LottoGear gives you more functions than you can expect.LottoGear is the best lottery Software but it's really the most distinctive one.Your can build filters from a real-time Statistic chart, which is reliable and safe. You can also know how safe a filter is. You can create any Statistic grid as your like.
Category: Home & Education / Miscellaneous
Publisher: ST-SOFT, License: Shareware, Price: USD $39.95, File Size: 10.7 MB
Platform: Windows
Chart java applet Software to generate dynamic charts and graphs - bar, line, pie, stacked and grouped charts in 2D and 3D with a wide range of parameters and chart types. Main features: Charts in 2D/3D, Anti aliasing, Multi language support, Cross browser compatible, Java Script parameter control, Data labels, Contextual data drill down, CSV data sources, Trend calculation, 3D depth...
Category: Software Development / Tools & Editors
Publisher: Swiftchart Limited, License: Demo, Price: USD $99.00, File Size: 97.0 KB
Platform: Windows, Mac, Linux, Unix, MS-DOS, AS, 400

Chart java applet Software to generate dynamic charts and graphs - bar, line, pie, stacked and grouped charts in 2D and 3D with a wide range of parameters and chart types. Main features: Charts in 2D/3D, Anti aliasing, Multi language support, Cross browser compatible, Java Script parameter control, Data labels, Contextual data drill down, CSV data sources, Trend calculation, 3D depth...
Category: Multimedia & Design
Publisher: Swiftchart Limited, License: Demo, Price: USD $99.00, File Size: 97.7 KB
Platform: Windows, Mac, Linux, Unix, MS-DOS, AS/400
Chart java applet Software to generate dynamic charts and graphs within JSP, servlets or java applications - bar, line, pie, stacked and grouped charts in 2D and 3D with a wide range of parameters and chart types. Main features: Charts in 2D/3D, Anti aliasing, Multi language support, Cross browser compatible, Java Script parameter control, Data labels, Contextual data drill down, CSV...
Category: Software Development / Tools & Editors
Publisher: Swiftchart Limited, License: Demo, Price: USD $99.00, File Size: 97.0 KB
Platform: Windows, Mac, Linux, Unix, MS-DOS, AS, 400

Chart java applet Software to generate dynamic charts and graphs within JSP, servlets or java applications - bar, line, pie, stacked and grouped charts in 2D and 3D with a wide range of parameters and chart types. Main features: Charts in 2D/3D, Anti aliasing, Multi language support, Cross browser compatible, Java Script parameter control, Data labels, Contextual data drill down, CSV...
Category: Software Development
Publisher: Swiftchart Limited, License: Demo, Price: USD $99.00, File Size: 97.7 KB
Platform: Windows, Mac, Linux, Unix, MS-DOS, AS/400
Graph constructs, visualizes and modifies graphs as well as calculates measures and layouts.
Graph constructs, visualizes and modifies graphs as well as calculates measures and layouts.
CoSBiLab Graph can construct, visualize and modify graphs as well as calculate measures and layouts. CoSBiLab Graph can import and export data in a variety of formats, among which the reaction network generated by the beta WorkBench.
Category: Multimedia & Design / Multimedia App's
Publisher: CoSBi, License: Freeware, Price: USD $0.00, File Size: 3.1 MB
Platform: Windows
Excel Graph Multiple Equations Software is an application that allows you to plot multiple functions in Microsoft Excel. It is able to create multiple charts based on the formulas entered. You can enter an equation manually or load multiple equations from a text file (.txt). The application is able to plot each equation on an individual Graph or all the equations on a...
Category: Business & Finance / MS Office Addons
Publisher: Sobolsoft, License: Shareware, Price: USD $19.99, File Size: 2.5 MB
Platform: Windows
The program allows to control an internet connection (Dial up, GPRS, VPN, XDSL,.
The program allows to control an internet connection (Dial up, GPRS, VPN, XDSL,...). With its help you can call up call dialog, break connection, control, how much time you've spent in the network, incoming and outgoing traffic.It has a flexible system of tariff adjustment. Possibilities: -Call of a reach dialog. -Internet connection indication. -Account of time, spent in on-line mode. -Account...
Category: Internet / Monitoring
Publisher: SimpleSoft, License: Shareware, Price: USD $18.95, File Size: 993.3 KB
Platform: Windows
DataPlot is a program where you can import your time based data and graph it.
DataPlot is a program where you can import your time based data and Graph it.You can move easily back and forward in user defined time window, allows individual time setting for each Graph, values read directly in Graph by dragging mouse over the curve and much more
Category: Multimedia & Design / Multimedia App's
Publisher: CBIM, License: Freeware, Price: USD $0.00, File Size: 311.0 KB
Platform: Windows
Click&Scout is the new statistic scouting software by Data Project.
Click&Scout is the new Statistic scouting Software by Data Project. Studied and developed for touch screen devices but can easily be used on all desktop and laptop pc’s with Windows and Mac OS. Click&Scout is ideal for on bench use for an immediate feedback of the progress of the match.
Category: Business & Finance / Business Finance
Publisher: Data project, License: Shareware, Price: USD $49.00, File Size: 79.1 MB
Platform: Windows
Drawing graphs without the right tool is simply difficult.
Drawing graphs without the right tool is simply difficult. uDraw(Graph) automates this task for you. Find out how uDraw(Graph) creates your flow charts, diagrams, hierarchies or structure visualizations using automatic layout - much faster than with any standard drawing program. With the API, uDraw(Graph) can even be embedded in your own programs as a visualization component.
Category: Multimedia & Design / Image Editing
Publisher: University Bremen, FB3, Germany, License: Freeware, Price: USD $0.00, File Size: 2.6 MB
Platform: Windows
ImageApp is a program that involves a lot of principles from machine vision.
ImageApp is a program that involves a lot of principles from machine vision. A GUI that allows you to build up an image processing Graph. An image processing Graph is essentially a sequence of algorithms that do something to images. You can imagine the Graph as the algorithms being the nodes and the flow-of-->data between the algorithms being the arcs.
For...
Category: Multimedia & Design / Multimedia App's
Publisher: Laurence Smith, License: Shareware, Price: USD $0.00, File Size: 0
Platform: Windows

Audio Graph ActiveX is an ActiveX (OCX) component for Software developers. With this ActiveX component you can display a meter, detect a silence, and display 2 types of audio graphs by the WaveIn/WaveOut buffers. Just send a pointer of the buffers array to the component then operate the Display function, the component will do the rest on the Graph view. You can set the...
Category: Software Development
Publisher: expresslib.com, License: Shareware, Price: USD $69.00, File Size: 806.5 KB
Platform: Windows
The WebViewer plug-in enables Windows users whether or not they have SigmaPlot to explore the data used to create the Graph.
Using the WebViewer plug-in with your Web browser window you can:
- View the data used to create the Graph
- Print a Graph in a web document at full resolution
- Zoom in and out of a Graph
- Grab and...
Category: Multimedia & Design / Graphics Viewers
Publisher: SYSTAT Software Inc., License: Freeware, Price: USD $0.00, File Size: 12.6 MB
Platform: Windows
myGolfCoach - Statistic, analysis, training and handicap management for golfers.
myGolfCoach - Statistic, analysis, training and handicap management for golfers.
Based on your input myGolfCoach calculates numerous trend analyses of several parts of your game and shows you the results in easy-to-understand graphics. Try this new feature and you will see your game from a different point of view!
Category: Home & Education / Miscellaneous
Publisher: Rehm & Sulzberger OEG, License: Shareware, Price: USD $0.00, File Size: 9.1 MB
Platform: Windows
With The Option Strategy Builder you could pick up an option and place it directly to the return Graph. As with the online tool, just drag and drop the option on the Graph, and build your strategy. Using your mouse, the options can be easily moved on the Graph to different strike prices, and to different expiration dates.
With this program you can manage your...
Category: Multimedia & Design / Multimedia App's
Publisher: SamoaSky, License: Freeware, Price: USD $0.00, File Size: 3.1 MB
Platform: Windows
Graphe Easy is a feature-rich yet easy-to-use 2d-graph plotting Windows software.
Graphe Easy is a feature-rich yet easy-to-use 2d-Graph plotting Windows Software. It allows to draw many Graph types (cartesian, polar, parametric coordinates) and many other graphs such as conics, integrals, inequations or sequences. It also provides a wide range of tools to comment on the graphics and get high quality results.
Category: Utilities / System Utilities
Publisher: Olivier ANSQUER, License: Shareware, Price: USD $39.00, File Size: 4.2 MB
Platform: Windows
Fly-through 3D graph software for exciting presentations, marketing, sales, analysis and fun!
Fly-through 3D Graph Software for exciting presentations, marketing, sales, analysis and fun! Capture the attention of your audience with spectacular 3D technology. Instead of showing your audience another boring line Graph, capture their interest with something wildly different. They will be more likely to talk about and remember your presentation that had something that...
Category: Business & Finance
Publisher: Swan Studios, License: Shareware, Price: USD $39.95, File Size: 8.5 MB
Platform: Windows
KaotiXL is an add in use to do a rescaled range analysis with MS Excel.
KaotiXL is an add in use to do a rescaled range analysis with MS Excel. User will learn how easy it is to use a worksheet as a powerful forecasting tool. It also generate a report with all the calculated values shown and 2 Graph are built. The R/S chart and V Statistic chart. Hurst exponent is also calculated and shown in this report. Charting in this program will make it easier...
Category: Business & Finance / Personal Finance
Publisher: XLPert Enterprise, License: Shareware, Price: USD $15.00, File Size: 85.0 KB
Platform: Windows
New Features of DataStudio:
- Video Player and Synchronization -- Play a movie or synch a movie to experimental data
- Presentation Style Graph -- Additional Graph style that moves measurements and units outside the Graph; ideal for publication of DataStudio graphs in educational journals
- Predictive Sketching -- Students can draw directly on the...
Category: Home & Education / Miscellaneous
Publisher: PASCO, License: Demo, Price: USD $0.00, File Size: 32.8 MB
Platform: Windows
Graph visualization is a way of representing structural information as diagrams of abstract graphs and networks. Automatic Graph drawing has many important applications in Software engineering, database and web design, networking, and in visual interfaces
Category: Multimedia & Design
Publisher: graphviz.org, License: Freeware, Price: USD $0.00, File Size: 26.6 MB
Platform: Windows, Mac, Vista