Free Downloads: Statistical Graph
Simfit is a computer package for simulation, Statistical analysis, curve fitting and Graph plotting using models from a compiled library or from ASCII text files supplied by the user. It can be used for teaching the principles of curve fitting, simulation and Statistical analysis to students, but it will be found most useful by those interested in serious data analysis and...
Category: Business & Finance / Applications
Publisher: University of Manchester, License: Freeware, Price: USD $0.00, File Size: 13.6 MB
Platform: Windows
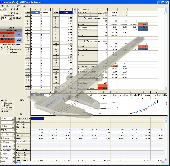
ANDI-Diveplanner is a statistical simulation software.
ANDI-Diveplanner is a Statistical simulation software.
The Dive Profile window displays a graphic representation of the current dive plan. It takes the form of an inverted line Graph. Displayed on the Graph is the depth and time of each profile segment (indicated with a blue line), with a graphical representation of gas changes (indicated with a scuba tank...
Category: Software Development / Misc. Programming
Publisher: Andi Systems PTY Ltd., License: Freeware, Price: USD $0.00, File Size: 474.2 KB
Platform: Windows
Stat-Box v1.0 is an easy-to-use and completely customizable vertical Graph/statistics scroller, perfect for displaying contest results, sports scores, survey results or any place where a color-coded Statistical display is required. It has support for images, custom backgrounds, links, adjustable scroll speed/direction and 9 different frame styles. Stat-Box v1.0 comes with 7...
Category: Software Development
Publisher: Spriteworks Developments, License: Demo, Price: USD $7.95, File Size: 761.3 KB
Platform: Unknown
The NetGraph – network monitor 2.
The NetGraph – network monitor 2.0 is a software network-monitoring program that enables users to see at a glance the activities on their networks including the volumes of traffic with four simple Graph mode indicators.
The program works on any Windows’ network connection and NetGraph – network monitor 2.0’s four modes include 2 snapshot modes and 2...
Category: Internet / Monitoring
Publisher: Nikola Dachev, License: Freeware, Price: USD $0.00, File Size: 0
Platform: Windows
ImageDIG consists of three integrated modules which allow the user to convert 2D flat images into 3D (x,y,z) data or if a Graph, convert the Graph in image form into 2 dimensional numerical data. The third module is a full analysis plotting utility where the user can import either the 2D or 3D data saved above or import any number of columns of data from a file. The data can then...
Category: Business & Finance / Applications
Publisher: SciCepts Engineering, License: Shareware, Price: USD $49.95, File Size: 0
Platform: Windows
The TeeChart Pro ActiveX charting component library offers hundreds of Graph styles in 2D and 3D, 33 mathematical and Statistical Functions for you to choose from together with an unlimited number of axes and 14 toolbox components.The Charting Control can be efficiently used to create multi task dashboards.
Category: Multimedia & Design / Multimedia App's
Publisher: Steema Software SL, License: Shareware, Price: USD $469.00, File Size: 25.0 MB
Platform: Windows
Statistical analysis and report-ready chart.
LeoReport is a software application for generating inspired report-ready graphic presentation of Statistical analysis of diversity of data. It's fast, portable, user-friendly with intuitive interface. LeoReport can create: a histogram of variable distribution with comparison Student and Poisson probability functions; two arguments distribution with 3D and color map presentation; curve...
Category: Home & Education / Mathematics
Publisher: Leonid Sakharov, License: Shareware, Price: USD $99.95, File Size: 490.0 KB
Platform: Unknown
 Demo
Demo
Imagine a complete Graphing solution assisting you right from importing data and manipulating data, plotting graphs, customizing looks, saving and exporting your graphs as high quality images and producing dynamic reports of your data in a matter of a few easy steps. Features: Data Import: Connects effortlessly with your MS SQL Server, Oracle, Access, XLS and CSV files and additionally...
Category: Software Development / Databases & Networks
Publisher: Teknowledge LLC, License: Demo, Price: USD $99.00, File Size: 8.1 MB
Platform: Windows
Create your own custom sheets of Graph paper. You have complete control over the Graph characteristics. X and Y axis can independently be set for linear or log scale. Selection from a dozen standard paper sizes, or custom create your own. Graphs saved as pdf files you can print them whenever you wish. Choose whatever color you want for the lines. Specify independent line weights...
Category: Home & Education
Publisher: Black Cat Systems, License: Shareware, Price: USD $19.99, File Size: 1.4 MB
Platform: Windows
LogAnalytics automatically accumulates the necessary data simultaneously from several polytypic log sources, realizes user-defined Statistical treatment and presents results in a set of easy-to-understand rotatable 3D graphs through a convenient WEB-based interface. Features: Automated and simultaneous source data gathering and Statistical treatment ;Various incoming data source:...
Category: Business & Finance / Applications
Publisher: SphinxSoftware, License: Shareware, Price: USD $69.95, File Size: 3.0 MB
Platform: Windows
Graph Studio is the open source graph drawing/processing software.
Graph Studio is the open source Graph drawing/processing software. It allows users to build and process highly customizable graphs.
Category: Multimedia & Design
Publisher: sourceforge.net, License: Freeware, Price: USD $0.00, File Size: 118.0 KB
Platform: Windows, Mac, Vista
Chart java applet software to generate dynamic charts and graphs - bar, line, pie, stacked and grouped charts in 2D and 3D with a wide range of parameters and chart types. Main features: Charts in 2D/3D, Anti aliasing, Multi language support, Cross browser compatible, Java Script parameter control, Data labels, Contextual data drill down, CSV data sources, Trend calculation, 3D depth control,...
Category: Software Development / Tools & Editors
Publisher: Swiftchart Limited, License: Demo, Price: USD $99.00, File Size: 97.0 KB
Platform: Windows, Mac, Linux, Unix, MS-DOS, AS, 400

Chart java applet software to generate dynamic charts and graphs - bar, line, pie, stacked and grouped charts in 2D and 3D with a wide range of parameters and chart types. Main features: Charts in 2D/3D, Anti aliasing, Multi language support, Cross browser compatible, Java Script parameter control, Data labels, Contextual data drill down, CSV data sources, Trend calculation, 3D depth control,...
Category: Multimedia & Design
Publisher: Swiftchart Limited, License: Demo, Price: USD $99.00, File Size: 97.7 KB
Platform: Windows, Mac, Linux, Unix, MS-DOS, AS/400
Rt-Plot is a tool to generate Cartesian X/Y-plots from scientific data.
Rt-Plot is a tool to generate Cartesian X/Y-plots from scientific data. You can enter and calculate tabular data. View the changing graphs, including linear and non linear regression, interpolation, differentiation and integration, during entering. Rt-Plot enables you to create plots fast and easily. The line calculations give full access to calculation and display ranges and can use...
Category: Home & Education / Mathematics
Publisher: Rt-Science, License: Shareware, Price: USD $29.90, File Size: 5.2 MB
Platform: Windows
DunWatch shows a graph of the current InterNet-Connection with transfer rate, volume and duration.
DunWatch shows a Graph of the current InterNet-Connection with transfer rate, volume and duration. It stores the data for Statistical evaluations like total of a month. Thus one can check easily how much of the free volume (DSL) has been used so far. This is freeware. The program supports dial-up connections such as modem, ISDN and DSL. LAN also is supported, at present however...
Category: Internet / Misc. Plugins
Publisher: Beadsoft, License: Freeware, Price: USD $0.00, File Size: 564.0 KB
Platform: Windows
Graph constructs, visualizes and modifies graphs as well as calculates measures and layouts.
Graph constructs, visualizes and modifies graphs as well as calculates measures and layouts.
CoSBiLab Graph can construct, visualize and modify graphs as well as calculate measures and layouts. CoSBiLab Graph can import and export data in a variety of formats, among which the reaction network generated by the beta WorkBench.
Category: Multimedia & Design / Multimedia App's
Publisher: CoSBi, License: Freeware, Price: USD $0.00, File Size: 3.1 MB
Platform: Windows
Cumulative Probability Plot does all of the Statistical mathematics for you and outputs the data in a visual format that can be easily interpreted by people with a limited knowledge of statistics.
The Graph is also useful for a quick demonstration to regulators or other interested parties that your product or process is within acceptable tolerance or meets regulatory...
Category: Multimedia & Design / Multimedia App's
Publisher: Rad Pro Calculator, License: Freeware, Price: USD $0.00, File Size: 8.8 MB
Platform: Windows
Distribution Guide is a program allowing to build various graphs of statistical distributions.
Distribution Guide is a program allowing to build various graphs of Statistical distributions. It enables you to enter the parameters of the particular distribution and display the graphs of such functions as PDF, CDF, and others. Printing support is provided as well.
Supported distributions:
- Exponential
- Lognormal
- Normal
- Weibull
- Uniform
Supported...
Category: Home & Education / Mathematics
Publisher: MathWave Technologies, License: Freeware, Price: USD $0.00, File Size: 1.1 MB
Platform: Windows
Statistical software for fast and easy interpretation of experimental data in science and R&D in a technical environment. This Statistical package helps with analysis and prevents making false assumptions. In short it makes statistics faster and easier, suitable for less experience users but advanced enough for more demanding users. Develve has no deep hidden menus, everything...
Category: Home & Education / Mathematics
Publisher: Develve, License: Shareware, Price: USD $79.00, EUR75, File Size: 3.2 MB
Platform: Windows

TeeChart VCL/FMX charting library provides entire featureset to create charts, maps and gauges in 2D, 3D for data visualization; 60+ chart styles and 50+ financial and Statistical indicators. It supports Embarcadero Windows IDEs (RAD Studio, Delphi, C++ Builder) and includes native code FireMonkey support enabling to compile applications for Windows, Mac OS, iOS/iPhone, Android. The...
Category: Software Development / Components: Delphi
Publisher: Steema Software, License: Shareware, Price: USD $479.00, File Size: 20.4 MB
Platform: Windows
InfoStat is general-purpose software for statistical analysis.
InfoStat is general-purpose software for Statistical analysis. It covers all the basic needs for descriptive Statistical analysis and the production of graphs for the exploratory analysis.
It also has advanced Statistical methods for Statistical modeling and multivariate analysis. One of its strengths is its simple interface combined with professional...
Category: Business & Finance / Business Finance
Publisher: Grupo InfoStat, License: Freeware, Price: USD $0.00, File Size: 33.9 MB
Platform: Windows

Chart java applet software to generate dynamic charts and graphs within JSP, servlets or java applications - bar, line, pie, stacked and grouped charts in 2D and 3D with a wide range of parameters and chart types. Main features: Charts in 2D/3D, Anti aliasing, Multi language support, Cross browser compatible, Java Script parameter control, Data labels, Contextual data drill down, CSV data...
Category: Software Development
Publisher: Swiftchart Limited, License: Demo, Price: USD $99.00, File Size: 97.7 KB
Platform: Windows, Mac, Linux, Unix, MS-DOS, AS/400
Chart java applet software to generate dynamic charts and graphs within JSP, servlets or java applications - bar, line, pie, stacked and grouped charts in 2D and 3D with a wide range of parameters and chart types. Main features: Charts in 2D/3D, Anti aliasing, Multi language support, Cross browser compatible, Java Script parameter control, Data labels, Contextual data drill down, CSV data...
Category: Software Development / Tools & Editors
Publisher: Swiftchart Limited, License: Demo, Price: USD $99.00, File Size: 97.0 KB
Platform: Windows, Mac, Linux, Unix, MS-DOS, AS, 400
DataPlot is a program where you can import your time based data and graph it.
DataPlot is a program where you can import your time based data and Graph it.You can move easily back and forward in user defined time window, allows individual time setting for each Graph, values read directly in Graph by dragging mouse over the curve and much more
Category: Multimedia & Design / Multimedia App's
Publisher: CBIM, License: Freeware, Price: USD $0.00, File Size: 311.0 KB
Platform: Windows
Drawing graphs without the right tool is simply difficult.
Drawing graphs without the right tool is simply difficult. uDraw(Graph) automates this task for you. Find out how uDraw(Graph) creates your flow charts, diagrams, hierarchies or structure visualizations using automatic layout - much faster than with any standard drawing program. With the API, uDraw(Graph) can even be embedded in your own programs as a visualization component.
Category: Multimedia & Design / Image Editing
Publisher: University Bremen, FB3, Germany, License: Freeware, Price: USD $0.00, File Size: 2.6 MB
Platform: Windows