Free Downloads: Stock Charts Excel
Excel Stock Quotes Software is a converter software program that converts Stock symbols to the current dollar Stock price in MS Excel. Excel 2000 or higher required. It is an easy to use program with direct options like adding Excel files or the whole sheet and the backup possibility.
Category: Business & Finance / Calculators
Publisher: Sobolsoft, License: Shareware, Price: USD $0.00, File Size: 0
Platform: Windows
 Shareware
CharTTool is an advanced Stock charting software that instantly allows you to display several technical Charts of stocks, mutual funds or indices. Intraday and end-of-day Stock charting is available. The list of technical indicators includes Bollinger bands, price channels, moving averages, fast and slow stochastic oscillators, relative strength index, MACD, trading volume...
Category: Business & Finance / Business Finance
Publisher: Ashkon Technology LLC, License: Shareware, Price: USD $39.95, File Size: 1.1 MB
Platform: Windows, Other
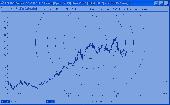
Tool to easily follow the stock market using Point and Figure charts.
Tool to easily follow the Stock market using Point and Figure Charts. Get a set of updated Charts everyday in your mailbox (or if you prefer download the Charts files from our website) We have Charts of the following markets: US US mutual funds, ETF's and iShares Canada United Kingdom Europe Australia Select stocks in minutes with our 'Buy the Winner' view!...
Category: Business & Finance / Applications
Publisher: Magic Potion, License: Demo, Price: USD $49.00, File Size: 7.6 MB
Platform: Windows,
Stock Chart Wizard downloads freely available Stock market data on individual stocks and displays technical Charts and indicators. You enter in the Stock tickers you wish to
analyze, and within seconds, line or bar Charts are displayed along with selected moving averages and indicators.
Category: Business & Finance / MS Office Addons
Publisher: stockchartwizard.com, License: Shareware, Price: USD $19.00, File Size: 0
Platform: Windows
This free software uses 19 intelligent and classic technical analysis methods, new Quotes (delayed 15 minutes) and historical Quotes to analyze Stock, displays 18 Charts in a window and marks buy/sell signals last 30 days on Charts. It can also display Dow's real time intraday Charts, Stock intraday chart indicators and many good articles about Market...
Category: Business & Finance / Business Finance
Publisher: Kingsoft, Inc., License: Freeware, Price: USD $0.00, File Size: 1.4 MB
Platform: Windows
Stock Quotes for Excel is a powerfull Add-in for Excel that allows you to update Stock Quotes automatically, Market Indexes and Mutual Funds into your Excel spreadsheets - via Internet. No more manual and tedious updates. No more risk of using outdated data. It seamlessly integrates to Microsoft Excel with functions that allow you to intuitively enter...
Category: Business & Finance / MS Office Addons
Publisher: Model Advisor, License: Shareware, Price: USD $99.95, File Size: 4.0 MB
Platform: Windows
Incredible Charts Pro is a stock market analysis and charting software.
Incredible Charts Pro is a Stock market analysis and charting software. It is very helpful for all those persons who invest in the big Stock markets of the world whether he is a small investor or a big player of this game. It directly connects to the Stock markets data provider companies. By using this incredible software you can view the last 11 years history of...
Category: Business & Finance / Business Finance
Publisher: Vizhon Corporation, License: Shareware, Price: USD $0.00, File Size: 0
Platform: Windows
Free Stock Charting Software with historical charts, technical analysis indicators and news.
Free Stock Charting Software with historical Charts, technical analysis indicators and news. We have taken the open source eclipse trade and cleaned up a version specific to news and Charts with technical analysis.
Category: Business & Finance / Business Finance
Publisher: pennystocknet.com, License: Freeware, Price: USD $0.00, File Size: 26.7 MB
Platform: Windows, Vista
RealtimeStockreader shows you the intraday charts of your stock symbols.
RealtimeStockreader shows you the intraday Charts of your Stock symbols. These Charts are being updated every minute (the updating interval can be configured).
RealtimeStockreader alerts you (acoustically) when stocks have reached limits. You can specify lower (STOP LOSS) and upper limits.
Category: Business & Finance / Business Finance
Publisher: realtimestockreader, License: Freeware, Price: USD $0.00, File Size: 69.6 KB
Platform: Windows
Grab It! is a Microsoft Excel based application that digitizes graphs or Charts to obtain the original data. Graphs and Charts can have data point values digitized or photos can have angle and distance measurements made. All data is placed directly into Excel for easy re-use. Skewed graphs are handled automatically (sometimes scanning isn't perfectly straight) as...
Category: Business & Finance
Publisher: DataTrend Software Inc, License: Demo, Price: USD $69.95, File Size: 840.1 KB
Platform: Windows

The ICS Free Financial Toolbar puts financial search, Stock quotes, Charts, SEC filings, Stock news, and financial audio commentary at your fingertips! It installs in Microsoft Internet Explorer in seconds and includes a free popup blocker, Google and Yahoo Search engines. You'll have instant access to the finest Charts and Stock tools on the web, including...
Category: Business & Finance / Personal Finance
Publisher: Ice Cold Stocks, License: Freeware, Price: USD $0.00, File Size: 975.5 KB
Platform: Windows
Dashboard tools for Excel helps you to understand complex relationships in your Excel data.
Dashboard tools for Excel helps you to understand complex relationships in your Excel data. With Mini Charts you can use Sparklines, Heatmaps, Mini Charts and Bump Charts, getting dramatically improved data visualization for fast and effective parallel comparisons.
Dashboard tools works with Excel personalization options. Because it has...
Category: Business & Finance / MS Office Addons
Publisher: JABSOFT, License: Shareware, Price: USD $0.00, File Size: 0
Platform: Windows
Freeware
Stock charting and technical analysis software with a user-friendly interface targeted for Stock investors and realtime traders. Supported dataproviders are Yahoo and Interactive Brokers. With the easy to use script language, you can create your own backtests, indicators, screener, real-time alerts and drawing tools! While you are backtesting, TickInvest creates a history of your...
Category: Business & Finance / Applications
Publisher: Erich Behmen, License: Freeware, Price: USD $0.00, File Size: 25.9 MB
Platform: Windows
Freeware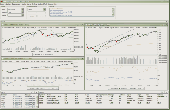
Stock charting and technical analysis software with a user-friendly interface targeted for Stock investors and realtime traders. Supported dataproviders are Yahoo and Interactive Brokers.With the easy to use script language, you can create your own backtests, indicators, screener, real-time alerts and drawing tools! While you are backtesting, TickInvest creates a history of your...
Category: Business & Finance / Business Finance
Publisher: Erich Behmen, License: Freeware, Price: USD $0.00, File Size: 27.4 MB
Platform: Windows
All charts are displayed in one window.
All Charts are displayed in one window. User may compare different Charts of one Stock or Charts of different stocks easily.
- Advanced indicators: EquiVolume, Point & Figure, GMMA, Heiken-Ashi, Volatility Stop Loss.
Point & Figure Charts consist of columns of X's and O's that represent filtered price movements over time....
Category: Multimedia & Design / Multimedia App's
Publisher: Stock-Anal, License: Shareware, Price: USD $0.00, File Size: 0
Platform: Windows
Have you ever seen a Stock chart and wondered what made the Stock shoot up like a rocket or drop like a rock? Stock Spy is unlike any other Stock chart because it helps explain what you're seeing. It clearly displays the news and company events which cause the price movements - directly on the chart. Stock Spy shows you relationship the between Stock...
Category: Business & Finance / Project Management
Publisher: Stock RSS News Alerts, License: Demo, Price: USD $39.95, File Size: 3.2 MB
Platform: Windows
eTikr is a free application that allows user to get, monitor and analyze Stock quotes and live market data directly in Excel. Streaming Stock quotes can be configured to setup custom views for power Excel users. Included are several pre-built Excel templa
Category: Business & Finance / Personal Finance
Publisher: etikr.com, License: Freeware, Price: USD $0.00, File Size: 3.7 MB
Platform: Windows
Parity Plus is one of the most powerful Stock Charting and Technical Analysis Programs available on the market. Parity includes over 50 of the most popular indicators for the technical analysis of stocks and commodities. The majority of these indicators act as functions that return an array, which can be used as the input to another indicator or within a user defined formula. This makes...
Category: Business & Finance / Project Management
Publisher: DITEC International, License: Shareware, Price: USD $122.00, File Size: 634.9 KB
Platform: Windows
Now you can have your own Stock charting analysis tool: System Fibonacci. With System Fibonacci you can create excellent looking Charts. Download historical prices for free as provided by Yahoo Finance to create sophisticated Charts with candlesticks, lines, price points and even zigzag lines. Two Fibonacci trendlines instead of just one, with retracements and projections...
Category: Business & Finance
Publisher: Jigaro Software, License: Shareware, Price: USD $5.00, File Size: 565.2 KB
Platform: Windows
Shareware
Imagine that you could continuously monitor multiple online images without having to open your browser! Use Just Watching to build a custom wallpaper that can display web cams, Stock Charts, weather maps and home security cams right on your desktop! You specify the update frequency so you can always keep track of the outside world, plus it will help keep you from losing your...
Category: Desktop Enhancements / Wallpaper
Publisher: Lincoln Beach Software, License: Shareware, Price: USD $14.95, File Size: 1.5 MB
Platform: Windows
Save all charts as images in one or many MS Excel files.
Save all Charts as images in one or many MS Excel files. Excel 2000 or higher required.
Category: Business & Finance / MS Office Addons
Publisher: Sobolsoft, License: Shareware, Price: USD $19.99, File Size: 340.0 KB
Platform: Windows

Technical Analysis in Microsoft Excel. 146 indicators and experts. Free download real and historical Stock quotes from USA, Europe, and Canada into Excel spreadsheets. Mutual funds, corporate bonds, Major USA Market Indices, Major World Indices are downloadable into Microsoft Excel spreadsheets. Daily, weekly and monthly quotes into one Excel spreadsheets....
Category: Business & Finance / Spreadsheets
Publisher: Franz AG, License: Shareware, Price: USD $249.95, File Size: 3.1 MB
Platform: Unknown
FCharts SE is a free Stock charting program which will import price data from a wide range of sources, displaying it as OHLC, Candlestick and Line Charts. It has a number of built-in indicators (MACD, RSI, Exponential and Standard Moving Averages), or you can write your own with the inbuilt formula language and display them as standalone Charts or overlays. You can draw...
Category: Business & Finance
Publisher: Spacejock Software, License: Freeware, Price: USD $0.00, File Size: 3.1 MB
Platform: Windows
If you do not understand Stock Charts nor technical analysis but you need help making successful trading decisions, then EzFibs is for you. If you are a technical expert and need a second opinion, then EzFibs is also for you. EzFibs will perform a technical analysis of a Stock's one year price history, like the experts do. Three strength indicators, Fibonacci support...
Category: Business & Finance / Vertical Markets
Publisher: Jigaro Software, License: Freeware, Price: USD $0.00, File Size: 578.5 KB
Platform: Windows
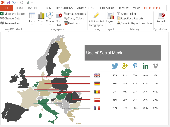
OfficeReports Link links data from Excel ranges to native PowerPoint tables, Charts and shapes. This can be done in such a way, so backgroundcolors from Excel cells are shown as logos and icons in PowerPoint. The Excel ranges can have a variable number of rows and/or columns, and OfficeReports is integrated with Excels and PowerPoints Macro engine. Microsoft...
Category: Business & Finance / Business Finance
Publisher: OfficeReports, License: Shareware, Price: USD $39.00, File Size: 609.0 KB
Platform: Windows