Free Downloads: Stock Charts Indicators Software
Stock Chart Wizard downloads freely available Stock market data on individual stocks and displays technical Charts and Indicators. You enter in the Stock tickers you wish to
analyze, and within seconds, line or bar Charts are displayed along with selected moving averages and Indicators.
Category: Business & Finance / MS Office Addons
Publisher: stockchartwizard.com, License: Shareware, Price: USD $19.00, File Size: 0
Platform: Windows
Free Stock Charting Software with historical charts, technical analysis indicators and news.
Free Stock Charting Software with historical Charts, technical analysis Indicators and news. We have taken the open source eclipse trade and cleaned up a version specific to news and Charts with technical analysis.
Category: Business & Finance / Business Finance
Publisher: pennystocknet.com, License: Freeware, Price: USD $0.00, File Size: 26.7 MB
Platform: Windows, Vista
Parity Plus is one of the most powerful Stock Charting and Technical Analysis Programs available on the market. Parity includes over 50 of the most popular Indicators for the technical analysis of stocks and commodities. The majority of these Indicators act as functions that return an array, which can be used as the input to another indicator or within a user defined...
Category: Business & Finance / Project Management
Publisher: DITEC International, License: Shareware, Price: USD $122.00, File Size: 634.9 KB
Platform: Windows
FCharts SE is a free Stock charting program which will import price data from a wide range of sources, displaying it as OHLC, Candlestick and Line Charts. It has a number of built-in Indicators (MACD, RSI, Exponential and Standard Moving Averages), or you can write your own with the inbuilt formula language and display them as standalone Charts or overlays. You can...
Category: Business & Finance
Publisher: Spacejock Software, License: Freeware, Price: USD $0.00, File Size: 3.1 MB
Platform: Windows
 Freeware
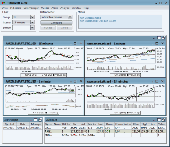
Stock charting and technical analysis Software with a user-friendly interface targeted for Stock investors and realtime traders. Supported dataproviders are Yahoo and Interactive Brokers. With the easy to use script language, you can create your own backtests, Indicators, screener, real-time alerts and drawing tools! While you are backtesting, TickInvest creates a...
Category: Business & Finance / Applications
Publisher: Erich Behmen, License: Freeware, Price: USD $0.00, File Size: 25.9 MB
Platform: Windows
Freeware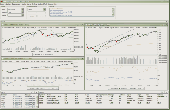
Stock charting and technical analysis Software with a user-friendly interface targeted for Stock investors and realtime traders. Supported dataproviders are Yahoo and Interactive Brokers.With the easy to use script language, you can create your own backtests, Indicators, screener, real-time alerts and drawing tools! While you are backtesting, TickInvest creates a...
Category: Business & Finance / Business Finance
Publisher: Erich Behmen, License: Freeware, Price: USD $0.00, File Size: 27.4 MB
Platform: Windows
Shareware
CharTTool is an advanced Stock charting Software that instantly allows you to display several technical Charts of stocks, mutual funds or indices. Intraday and end-of-day Stock charting is available. The list of technical Indicators includes Bollinger bands, price channels, moving averages, fast and slow stochastic oscillators, relative strength index, MACD,...
Category: Business & Finance / Business Finance
Publisher: Ashkon Technology LLC, License: Shareware, Price: USD $39.95, File Size: 1.1 MB
Platform: Windows, Other
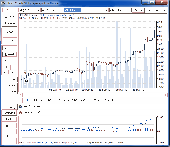
This free Software uses 19 intelligent and classic technical analysis methods, new Quotes (delayed 15 minutes) and historical Quotes to analyze Stock, displays 18 Charts in a window and marks buy/sell signals last 30 days on Charts. It can also display Dow's real time intraday Charts, Stock intraday chart Indicators and many good articles...
Category: Business & Finance / Business Finance
Publisher: Kingsoft, Inc., License: Freeware, Price: USD $0.00, File Size: 1.4 MB
Platform: Windows
EquityRider is an advanced Stock charting and trading systems analysis Software for many markets: stocks, forex, and futures. It allows you to create custom Indicators, derive Indicators based on standard ones, and plot them on Charts Real-Time or historical. Test custom trading strategies on up to 30 years of historical data. Monitor your portfolio for...
Category: Business & Finance
Publisher: Equity Rider Trading Inc., License: Shareware, Price: USD $25.99, File Size: 1.0 MB
Platform: Windows
All charts are displayed in one window.
All Charts are displayed in one window. User may compare different Charts of one Stock or Charts of different stocks easily.
- Advanced Indicators: EquiVolume, Point & Figure, GMMA, Heiken-Ashi, Volatility Stop Loss.
Point & Figure Charts consist of columns of X's and O's that represent filtered price movements over...
Category: Multimedia & Design / Multimedia App's
Publisher: Stock-Anal, License: Shareware, Price: USD $0.00, File Size: 0
Platform: Windows
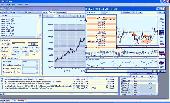
TurTrades lets you practice Stock market trading, by replaying REAL historical Stock prices and technical Indicators. You can get years of trading experience in few hours, by replaying Stock market data while you practice trading. TurTrades could be also used to look at historical Charts and prices. It is sort of paper trading in the past and next day is only...
Category: Business & Finance / Small Business Tools
Publisher: TurTrades, License: Freeware, Price: USD $0.00, File Size: 329.9 KB
Platform: Windows
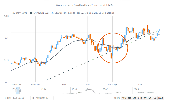
If you do not understand Stock Charts nor technical analysis but you need help making successful trading decisions, then EzFibs is for you. If you are a technical expert and need a second opinion, then EzFibs is also for you. EzFibs will perform a technical analysis of a Stock's one year price history, like the experts do. Three strength Indicators, Fibonacci...
Category: Business & Finance / Vertical Markets
Publisher: Jigaro Software, License: Freeware, Price: USD $0.00, File Size: 578.5 KB
Platform: Windows
FCharts SE is a free Stock charting program which will import price data from a wide range of sources, displaying it as OHLC, Candlestick and Line Charts. It has a number of built-in Indicators (MACD, RSI, Exponential and Standard Moving Averages), or you can write your own with the inbuilt formula language and display them as standalone Charts or overlays. You can...
Category: Business & Finance / Business Finance
Publisher: Spacejock Software, License: Freeware, Price: USD $0.00, File Size: 3.1 MB
Platform: Windows, Vista
FCharts SE is a free Stock charting program which will import price data from a wide range of sources, displaying it as OHLC, Candlestick and Line Charts. It has a number of built-in Indicators (MACD, RSI, Exponential and Standard Moving Averages), or you can write your own with the inbuilt formula language and display them as standalone Charts or overlays. You can...
Category: Business & Finance / Business Finance
Publisher: Spacejock Software, License: Freeware, Price: USD $0.00, File Size: 3.1 MB
Platform: Windows
AnyChart Stock and Financial JS Charts (short: AnyStock) is a JavaScript based financial and Stock charting library, also used for visualizing any timeline data over a long time. AnyStock technology turns your real-time data into highly sophisticated Charts with interactive features, bringing visualization of your data to the Web and providing a full feature set for...
Category: Web Authoring / JavaScript
Publisher: AnyChart JavaScript Charts, License: Shareware, Price: USD $49.00, File Size: 17.7 MB
Platform: Windows, Mac, Linux,
Shareware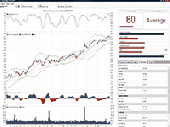
Real-Time Stock Market Strength Ratings Accurate Price Projections Professional Charts And Reports StockAnalyst is one of the leading Stock market research, analysis and rating systems on the market. In just seconds, it will provide you with real-time strength ratings, accurate price projections, detailed reports, professional Charts, and much more. Think of...
Category: Business & Finance / Applications
Publisher: Traders Direct, License: Shareware, Price: USD $499.95, File Size: 10.7 MB
Platform: Windows
Shareware
Ashkon Stock Watch is an advanced charting Software for financial market information. Unlike a conventional financial website it allows to display several technical Indicators for a single security on the same chart, open multiple chart documents, maintain predefined lists of securities and test your own investment strategies. Ashkon Stock Watch has several built in...
Category: Business & Finance / Business Finance
Publisher: Ashkon Technology LLC, License: Shareware, Price: USD $95.00, File Size: 3.4 MB
Platform: Windows, Other
Tool to easily follow the stock market using Point and Figure charts.
Tool to easily follow the Stock market using Point and Figure Charts. Get a set of updated Charts everyday in your mailbox (or if you prefer download the Charts files from our website) We have Charts of the following markets: US US mutual funds, ETF's and iShares Canada United Kingdom Europe Australia Select stocks in minutes with our 'Buy the Winner' view!...
Category: Business & Finance / Applications
Publisher: Magic Potion, License: Demo, Price: USD $49.00, File Size: 7.6 MB
Platform: Windows,
Incredible Charts Pro is a stock market analysis and charting software.
Incredible Charts Pro is a Stock market analysis and charting Software. It is very helpful for all those persons who invest in the big Stock markets of the world whether he is a small investor or a big player of this game. It directly connects to the Stock markets data provider companies. By using this incredible Software you can view the last 11 years...
Category: Business & Finance / Business Finance
Publisher: Vizhon Corporation, License: Shareware, Price: USD $0.00, File Size: 0
Platform: Windows
Stock Options Online Indicators.
Stock Options Online Indicators. Implied Volatility, Covered Call Rate, Delta and much more.
Category: Business & Finance / Business Finance
Publisher: optionstradedata.com, License: Freeware, Price: USD $0.00, File Size: 279.0 KB
Platform: Windows, Mac, 2K, 2K3, Vista
QChartist is a free charting Software to do technical analysis on any data like Forex, Stocks. It helps to make market forecasts with the help of technical objects and Indicators. You can draw geometrical shapes on your Charts or plot programmable Indicators from your data. It is also possible to filter or merge data. It has built-in astro Indicators and...
Category: Business & Finance / Business Finance
Publisher: Julien Moog, License: Freeware, Price: USD $0.00, File Size: 1.1 MB
Platform: Windows, Other
ChartSmart™ is a complete investment Software package for Stock charting, screening, and researching securities on the major US and Canadian Stock exchanges.
Powerful filtering and screening capabilities enable you to choose from over 15,000 stocks and select the ones that match your customized specifications. When done, simply sort and view the...
Category: Business & Finance / Business Finance
Publisher: ChartSmart Software Inc., License: Shareware, Price: USD $24.00, File Size: 329.0 MB
Platform: Windows

Technical Analysis in Microsoft Excel. 146 Indicators and experts. Free download real and historical Stock quotes from USA, Europe, and Canada into Excel spreadsheets. Mutual funds, corporate bonds, Major USA Market Indices, Major World Indices are downloadable into Microsoft Excel spreadsheets. Daily, weekly and monthly quotes into one Excel spreadsheets. Quotes refresh. The best...
Category: Business & Finance / Spreadsheets
Publisher: Franz AG, License: Shareware, Price: USD $249.95, File Size: 3.1 MB
Platform: Unknown
Scan Workshop / NeoTicker EOD is an advanced investment tool with easy to use intelligent scanning, intraday quotes, animated tickers, portfolio tracking and programmable technical analysis Stock charting. It is designed for people who require a sophisticated Stock analysis tool beyond what websites and brokers can offer. Scan Workshop is built on top of NeoTicker EOD to perform...
Category: Business & Finance / Applications
Publisher: TickQuest Inc., License: Shareware, Price: USD $69.00, File Size: 29.8 MB
Platform: Windows
Trade-Radar Stock Inspector evaluates a total of 40 Indicators and flashes a simple go/no-go/caution signal for each one. See at a glance whether a Stock is over-valued, whether it's in a down-trend or an up-trend or whether a reversal may be playing out.
Category: Business & Finance / Vertical Markets
Publisher: Trade-Radar, License: Shareware, Price: USD $39.35, File Size: 21.8 MB
Platform: Windows