Free Downloads: Visualization Graph
Graph Visualization is a way of representing structural information as diagrams of abstract graphs and networks. Automatic Graph drawing has many important applications in software engineering, database and web design, networking, and in visual interfaces
Category: Multimedia & Design
Publisher: graphviz.org, License: Freeware, Price: USD $0.00, File Size: 26.6 MB
Platform: Windows, Mac, Vista
JGraph is the leading Open Source Java Graph Visualization Library.
JGraph is the leading Open Source Java Graph Visualization Library. It follows Swing design patterns to provide an API familiar to Swing programmers and functionality that provides a range of features. Graph Visualization is a central requirement for applications such as workflow editors, computer and telecommunication networks display, flowcharts, VLSI and CAD,...
Category: Software Development / Components & Libraries
Publisher: JGraph Ltd, License: Freeware, Price: USD $0.00, File Size: 136.0 KB
Platform: Windows, Linux, Mac
Drawing graphs without the right tool is simply difficult.
Drawing graphs without the right tool is simply difficult. uDraw(Graph) automates this task for you. Find out how uDraw(Graph) creates your flow charts, diagrams, hierarchies or structure visualizations using automatic layout - much faster than with any standard drawing program. With the API, uDraw(Graph) can even be embedded in your own programs as a Visualization...
Category: Multimedia & Design / Image Editing
Publisher: University Bremen, FB3, Germany, License: Freeware, Price: USD $0.00, File Size: 2.6 MB
Platform: Windows
yFiles FLEX makes it easy to integrate sophisticated Graph Visualization and editing functionality into a rich Internet application based on Adobe® Flex® or AIR™. The framework provides a full-featured Flex UI component for viewing and editing diagrams along with a comprehensive Graph drawing and editing class library.
Category: Multimedia & Design / Image Editing
Publisher: yWorks GmbH, License: Demo, Price: USD $0.00, File Size: 122.5 MB
Platform: Windows
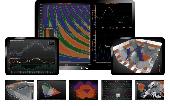
LightningChart Ultimate is the fastest 2D and 3D measurement, engineering and research data Visualization SDK for .NET and Windows.
LightningChart Ultimate is entirely GPU accelerated (Direct3D) and performance optimized data Visualization control for presenting masses of data in 2D XY Graph, 3D XYZ, polar and 3D pie / donut views.
Category: Business & Finance / Applications
Publisher: Arction Ltd, License: Shareware, Price: USD $2470.00, File Size: 185.9 MB
Platform: Windows
 Demo
Demo
Imagine a complete Graphing solution assisting you right from importing data and manipulating data, plotting graphs, customizing looks, saving and exporting your graphs as high quality images and producing dynamic reports of your data in a matter of a few easy steps. Features: Data Import: Connects effortlessly with your MS SQL Server, Oracle, Access, XLS and CSV files and additionally...
Category: Software Development / Databases & Networks
Publisher: Teknowledge LLC, License: Demo, Price: USD $99.00, File Size: 8.1 MB
Platform: Windows
Fly-through 3D graph software for exciting presentations, marketing, sales, analysis and fun!
Fly-through 3D Graph software for exciting presentations, marketing, sales, analysis and fun! Capture the attention of your audience with spectacular 3D technology. Instead of showing your audience another boring line Graph, capture their interest with something wildly different. They will be more likely to talk about and remember your presentation that had something that stood...
Category: Business & Finance
Publisher: Swan Studios, License: Shareware, Price: USD $39.95, File Size: 8.5 MB
Platform: Windows
The flexible and powerful Data Mining and Interactive Visualization tool.
The flexible and powerful Data Mining and Interactive Visualization tool.
Import your data and navigate at the speed of light. The tool disappears, your preferences and insight come into the spotlight.
Analyze both entities and relationships (Graph and network analytics).
Build and debug predictive models, cluster similar cases together, map...
Category: Multimedia & Design / Graphics Viewers
Publisher: Reactive Search Srl, License: Shareware, Price: USD $0.00, File Size: 0
Platform: Windows
TeeChart VCL/FMX charting library provides entire featureset to create charts, maps and gauges in 2D, 3D for data Visualization; 60+ chart styles and 50+ financial and statistical indicators. It supports Embarcadero Windows IDEs (RAD Studio, Delphi, C++ Builder) and includes native code FireMonkey support enabling to compile applications for Windows, Mac OS, iOS/iPhone, Android. The...
Category: Software Development / Components: Delphi
Publisher: Steema Software, License: Shareware, Price: USD $479.00, File Size: 20.4 MB
Platform: Windows
CentiBiN is an application for the calculation and Visualization of centralities for biological networks.
Features:
- Computing different vertex and Graph centrality measures
- Visualize a network and the computed centralities with five different layout algorithms
- Display distribution plots and histograms for computed centralities
- Reading and...
Category: Internet / Misc. Plugins
Publisher: Dirk Koschuetzki, IPK Gatersleben, Germany, License: Freeware, Price: USD $0.00, File Size: 4.8 MB
Platform: Windows
Create your own custom sheets of Graph paper. You have complete control over the Graph characteristics. X and Y axis can independently be set for linear or log scale. Selection from a dozen standard paper sizes, or custom create your own. Graphs saved as pdf files you can print them whenever you wish. Choose whatever color you want for the lines. Specify independent line weights...
Category: Home & Education
Publisher: Black Cat Systems, License: Shareware, Price: USD $19.99, File Size: 1.4 MB
Platform: Windows
VizHR is a simple to use yet extremely powerful organization resource Visualization and analytics tool that is favored by many HR professionals.VizHR gives you a bird's eye view of all employees (50 thousand employees? No problem!) and instance visual analysis by superposing multi-data color mappings on top of the employee hierarchy Graph.
Category: Multimedia & Design / Multimedia App's
Publisher: Blueline Graphics, License: Shareware, Price: USD $168.00, File Size: 22.4 MB
Platform: Windows
Graph Studio is the open source graph drawing/processing software.
Graph Studio is the open source Graph drawing/processing software. It allows users to build and process highly customizable graphs.
Category: Multimedia & Design
Publisher: sourceforge.net, License: Freeware, Price: USD $0.00, File Size: 118.0 KB
Platform: Windows, Mac, Vista
LightningChart Ultimate is the fastest 2D and 3D measurement, engineering and research data Visualization SDK for .NET, WPF and WinForms. LightningChart Ultimate is entirely GPU accelerated (Direct3D) and performance optimized data Visualization control for presenting masses of data in 2D Graph view, 3D view and polar views. LightningChart Ultimate's Graph view is...
Category: Software Development / Components & Libraries
Publisher: Arction Ltd, License: Shareware, Price: USD $2470.00, File Size: 1024 B
Platform: Windows
BALLView is a standalone molecular modeling and visualization application.
BALLView is a standalone molecular modeling and Visualization application. Furthermore it is also a framework for developing molecular Visualization functionality. It is available free of charge under the GPL for Linux, Windows and MacOS.
BALLView is a free molecular modeling and molecular graphics tool. It provides fast OpenGL-based Visualization of molecular...
Category: Home & Education / Science
Publisher: Plone Foundation, License: Freeware, Price: USD $0.00, File Size: 38.0 MB
Platform: Windows
Shareware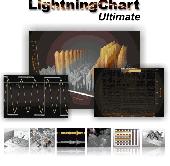
LightningChart Ultimate is the fastest 2D and 3D measurement, engineering and research data Visualization SDK for .NET and Windows. LightningChart Ultimate is entirely GPU accelerated (Direct3D) and performance optimized data Visualization control for presenting masses of data in 2D Graph view, 3D view and polar views. LightningChart Ultimate's Graph view is...
Category: Software Development / Components & Libraries
Publisher: Arction Ltd, License: Shareware, Price: USD $2470.00, EUR1900, File Size: 19.1 MB
Platform: Windows
Corel Visual Intelligence offers powerful data Visualization tools that allows you to extract, summarize, sort, and present complex information very easily. The program comes in three editions: Home, Growing Business and Professional. Each of them present different features to satisfy your needs. You can create different charts, graphs and tables to reflect the latest results, including...
Category: Business & Finance / MS Office Addons
Publisher: Corel Corporation, License: Shareware, Price: USD $99.00, File Size: 0
Platform: Windows
Chart java applet software to generate dynamic charts and graphs - bar, line, pie, stacked and grouped charts in 2D and 3D with a wide range of parameters and chart types. Main features: Charts in 2D/3D, Anti aliasing, Multi language support, Cross browser compatible, Java Script parameter control, Data labels, Contextual data drill down, CSV data sources, Trend calculation, 3D depth control,...
Category: Software Development / Tools & Editors
Publisher: Swiftchart Limited, License: Demo, Price: USD $99.00, File Size: 97.0 KB
Platform: Windows, Mac, Linux, Unix, MS-DOS, AS, 400

Chart java applet software to generate dynamic charts and graphs - bar, line, pie, stacked and grouped charts in 2D and 3D with a wide range of parameters and chart types. Main features: Charts in 2D/3D, Anti aliasing, Multi language support, Cross browser compatible, Java Script parameter control, Data labels, Contextual data drill down, CSV data sources, Trend calculation, 3D depth control,...
Category: Multimedia & Design
Publisher: Swiftchart Limited, License: Demo, Price: USD $99.00, File Size: 97.7 KB
Platform: Windows, Mac, Linux, Unix, MS-DOS, AS/400
Graph constructs, visualizes and modifies graphs as well as calculates measures and layouts.
Graph constructs, visualizes and modifies graphs as well as calculates measures and layouts.
CoSBiLab Graph can construct, visualize and modify graphs as well as calculate measures and layouts. CoSBiLab Graph can import and export data in a variety of formats, among which the reaction network generated by the beta WorkBench.
Category: Multimedia & Design / Multimedia App's
Publisher: CoSBi, License: Freeware, Price: USD $0.00, File Size: 3.1 MB
Platform: Windows
Demo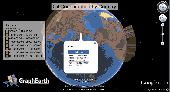
Visualize your data in 3D! Quick, easy and inexpensive. Graph Earth enables management, marketing and other business professionals to create stunning visual representations of their data, all without the time and costs associated with a full-featured GIS. Viewable by Everyone! Create one of a kind deliverables and distribute them to the world, recipients need only install Google Earth...
Category: Business & Finance / MS Office Addons
Publisher: Deer Creek Marketing LLC, License: Demo, Price: USD $24.95, File Size: 469.0 KB
Platform: Windows
Trend Compass is a data Visualization software using the latest and most powerful ideas in data Visualization which is the Animated Motion Chart.
Data Visualization is the study of the visual representation of data, defined as information which has been abstracted in some schematic form, including attributes or variables for the units of information.
...
Category: Multimedia & Design / Multimedia App's
Publisher: EpicSystems, License: Shareware, Price: USD $3500.00, File Size: 14.9 MB
Platform: Windows

Chart java applet software to generate dynamic charts and graphs within JSP, servlets or java applications - bar, line, pie, stacked and grouped charts in 2D and 3D with a wide range of parameters and chart types. Main features: Charts in 2D/3D, Anti aliasing, Multi language support, Cross browser compatible, Java Script parameter control, Data labels, Contextual data drill down, CSV data...
Category: Software Development
Publisher: Swiftchart Limited, License: Demo, Price: USD $99.00, File Size: 97.7 KB
Platform: Windows, Mac, Linux, Unix, MS-DOS, AS/400
Chart java applet software to generate dynamic charts and graphs within JSP, servlets or java applications - bar, line, pie, stacked and grouped charts in 2D and 3D with a wide range of parameters and chart types. Main features: Charts in 2D/3D, Anti aliasing, Multi language support, Cross browser compatible, Java Script parameter control, Data labels, Contextual data drill down, CSV data...
Category: Software Development / Tools & Editors
Publisher: Swiftchart Limited, License: Demo, Price: USD $99.00, File Size: 97.0 KB
Platform: Windows, Mac, Linux, Unix, MS-DOS, AS, 400
DataPlot is a program where you can import your time based data and graph it.
DataPlot is a program where you can import your time based data and Graph it.You can move easily back and forward in user defined time window, allows individual time setting for each Graph, values read directly in Graph by dragging mouse over the curve and much more
Category: Multimedia & Design / Multimedia App's
Publisher: CBIM, License: Freeware, Price: USD $0.00, File Size: 311.0 KB
Platform: Windows