Free Downloads: Graph Charting Software
License: All | Free
XYGraph is a native . NET charting component showing data in a cartesian graph (X,Y).
Controls from componentXtra gives royalty free software integration. Both the free and purchased products includes sample code (VB and C#). .
Category: Software Development
Publisher: componentXtra, License: Freeware, Price: USD $0.00, File Size: 390.6 KB
Platform: Windows
Graph Studio is the open source graph drawing/processing software.
Graph Studio is the open source Graph drawing/processing Software. It allows users to build and process highly customizable graphs.
Category: Multimedia & Design
Publisher: sourceforge.net, License: Freeware, Price: USD $0.00, File Size: 118.0 KB
Platform: Windows, Mac, Vista
 Freeware
Behind every successful trader or investor is a Charting Software. We are lowering your operating cost as a trader and investor by offering you ChartNexus Charting Software for FREE! It comes complete with a comprehensive list of popular indicators and even better, we are offering 3 years of market data for free too! On top of that, you have free access to all...
Category: Business & Finance / Applications
Publisher: ChartNexus, License: Freeware, Price: USD $0.00, File Size: 3.4 MB
Platform: Windows
Graph constructs, visualizes and modifies graphs as well as calculates measures and layouts.
Graph constructs, visualizes and modifies graphs as well as calculates measures and layouts.
CoSBiLab Graph can construct, visualize and modify graphs as well as calculate measures and layouts. CoSBiLab Graph can import and export data in a variety of formats, among which the reaction network generated by the beta WorkBench.
Category: Multimedia & Design / Multimedia App's
Publisher: CoSBi, License: Freeware, Price: USD $0.00, File Size: 3.1 MB
Platform: Windows
DataPlot is a program where you can import your time based data and graph it.
DataPlot is a program where you can import your time based data and Graph it.You can move easily back and forward in user defined time window, allows individual time setting for each Graph, values read directly in Graph by dragging mouse over the curve and much more
Category: Multimedia & Design / Multimedia App's
Publisher: CBIM, License: Freeware, Price: USD $0.00, File Size: 311.0 KB
Platform: Windows
Drawing graphs without the right tool is simply difficult.
Drawing graphs without the right tool is simply difficult. uDraw(Graph) automates this task for you. Find out how uDraw(Graph) creates your flow charts, diagrams, hierarchies or structure visualizations using automatic layout - much faster than with any standard drawing program. With the API, uDraw(Graph) can even be embedded in your own programs as a visualization component.
Category: Multimedia & Design / Image Editing
Publisher: University Bremen, FB3, Germany, License: Freeware, Price: USD $0.00, File Size: 2.6 MB
Platform: Windows
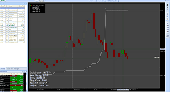
FCharts SE is a free stock Charting program which will import price data from a wide range of sources, displaying it as OHLC, Candlestick and Line charts. It has a number of built-in indicators (MACD, RSI, Exponential and Standard Moving Averages), or you can write your own with the inbuilt formula language and display them as standalone charts or overlays. You can draw trend lines with...
Category: Business & Finance
Publisher: Spacejock Software, License: Freeware, Price: USD $0.00, File Size: 3.1 MB
Platform: Windows
BursaStation is a state-of-the-art Stock Market Tracker / Share Market Tracker cum Charting Software (Charting Tool) that places in your hands the power to make better investment decisions.
Brought to you as a collaborative effort by ShareInvestor and Bursa Malaysia, BursaStation is designed with you, the user, in mind, as a user-friendly yet full of powerful...
Category: Business & Finance / Business Finance
Publisher: SI Portal.com Sdn. Bhd., License: Freeware, Price: USD $0.00, File Size: 4.7 MB
Platform: Windows
The WebViewer plug-in enables Windows users whether or not they have SigmaPlot to explore the data used to create the Graph.
Using the WebViewer plug-in with your Web browser window you can:
- View the data used to create the Graph
- Print a Graph in a web document at full resolution
- Zoom in and out of a Graph
- Grab and...
Category: Multimedia & Design / Graphics Viewers
Publisher: SYSTAT Software Inc., License: Freeware, Price: USD $0.00, File Size: 12.6 MB
Platform: Windows
Software FX is offering a free charting solution for Windows Forms created with Visual Studio.
Software FX is offering a free Charting solution for Windows Forms created with Visual Studio.Net or C# Builder. With Chart FX Lite for .NET you will be able to integrate basic Charting capabilities into your Windows Forms applications. Whether you code in C# or VB.NET, you will find Chart FX Lite for .NET is an extremely versatile Charting control that can be...
Category: Web Authoring / Web Design Utilities
Publisher: Software FX Inc., License: Freeware, Price: USD $0.00, File Size: 2.3 MB
Platform: Windows
With The Option Strategy Builder you could pick up an option and place it directly to the return Graph. As with the online tool, just drag and drop the option on the Graph, and build your strategy. Using your mouse, the options can be easily moved on the Graph to different strike prices, and to different expiration dates.
With this program you can manage your...
Category: Multimedia & Design / Multimedia App's
Publisher: SamoaSky, License: Freeware, Price: USD $0.00, File Size: 3.1 MB
Platform: Windows
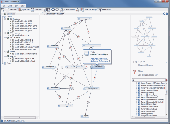
Graph visualization is a way of representing structural information as diagrams of abstract graphs and networks. Automatic Graph drawing has many important applications in Software engineering, database and web design, networking, and in visual interfaces
Category: Multimedia & Design
Publisher: graphviz.org, License: Freeware, Price: USD $0.00, File Size: 26.6 MB
Platform: Windows, Mac, Vista

Archim is a program for drawing the graphs of all kinds of functions. You can define a Graph explicitly and parametrically, in polar and spherical coordinates, on a plane and in space (surface). Archim will be useful for teachers and students, as well as for everyone who is interested min geometry. With Archim, you will draw the Graph of any function and form, just use your...
Category: Home & Education
Publisher: Stochastic Lab, License: Freeware, Price: USD $0.00, File Size: 479.6 KB
Platform: Windows
Graph-A-Ping allows you to visually see the ping latency between ping times.
Graph-A-Ping allows you to visually see the ping latency between ping times. The bigger the gap between one ping to another allows you to spot possible network bottle neck.
This tool is actually an applet part of Glass Net Networks monitoring console.
Category: Internet / Misc. Plugins
Publisher: Mataluis.Com, License: Freeware, Price: USD $0.00, File Size: 2.1 MB
Platform: Windows
FusionCharts Free is a flash Charting component that can be used to render data-driven & animated charts for your web applications and presentations. It is a cross-browser and cross-platform solution that can be used with ASP.NET, ASP, PHP, JSP, ColdFusion, Ruby on Rails, simple HTML pages or even PowerPoint Presentations to deliver interactive and powerful flash charts. You do NOT...
Category: Software Development
Publisher: InfoSoft Global (P) Ltd., License: Freeware, Price: USD $0.00, File Size: 2.7 MB
Platform: Windows, Mac, Linux,
T&D Graph has been designed as a user friendly Software which brings users even more effective tools for the management and analysis of data recorded by T&D Data Loggers. It contains a variety of useful functions including the ability to read and merge multiple data files and display recorded data in Graph and/or list form.
Category: Software Development / Misc. Programming
Publisher: T&D CORPORATION, License: Freeware, Price: USD $0.00, File Size: 11.3 MB
Platform: Windows
The NetGraph – network monitor 2.
The NetGraph – network monitor 2.0 is a Software network-monitoring program that enables users to see at a glance the activities on their networks including the volumes of traffic with four simple Graph mode indicators.
The program works on any Windows’ network connection and NetGraph – network monitor 2.0’s four modes include 2 snapshot modes...
Category: Internet / Monitoring
Publisher: Nikola Dachev, License: Freeware, Price: USD $0.00, File Size: 0
Platform: Windows
Graph Extract is a program for digitizing plots.
Graph Extract is a program for digitizing plots. Using either manual or automated approaches, this program provides a means to easily extract numeric data from plots. The resulting X-Y data can be printed or replotted, or it can be saved in Excel file for
Category: Multimedia & Design
Publisher: quadtechassociates.com, License: Freeware, Price: USD $0.00, File Size: 446.0 KB
Platform: Windows
Function Analyzer is a program that draws the Graph of a function with one variable declared by the user. The operators used to build the mathematical expression are the usual ones used in Software calculators: * for multiplying, / for dividing, ^ for power and so on. Parentheses can be used to group terms in your expression. Trigonometric functions are also supported, along with...
Category: Home & Education / Mathematics
Publisher: Lorenzi Davide, License: Freeware, Price: USD $0.00, File Size: 1.3 MB
Platform: Windows
MathTrax is a graphing tool for middle school and high school students to Graph equations, physics simulations or plot data files.
The graphs have descriptions and sound so you can hear and read about the Graph. Blind and low vision users can access visual math data and Graph or experiment with equations and datasets.
Category: Business & Finance / Applications
Publisher: The MathTrax Team, License: Freeware, Price: USD $0.00, File Size: 21.0 MB
Platform: Windows
RJS Graph produces professional scientific and mathematical graphs.
RJS Graph produces professional scientific and mathematical graphs. You may study the data with a wide range of data analysis tools. Features include the ability to plot data and equations, fit best fit curves and splines, and display fitted best fit curve parameters. Data can be pasted from a spreadsheet or imported from a text file using a wizard.
Category: Home & Education / Mathematics
Publisher: RJS, License: Freeware, Price: USD $0.00, File Size: 3.7 MB
Platform: Windows
JGraph is the leading Open Source Java Graph Visualization Library.
JGraph is the leading Open Source Java Graph Visualization Library. It follows Swing design patterns to provide an API familiar to Swing programmers and functionality that provides a range of features. Graph visualization is a central requirement for applications such as workflow editors, computer and telecommunication networks display, flowcharts, VLSI and CAD, business process...
Category: Software Development / Components & Libraries
Publisher: JGraph Ltd, License: Freeware, Price: USD $0.00, File Size: 136.0 KB
Platform: Windows, Linux, Mac
PeCo-Graph is the Software for the procurement and graphical visualisation of the counting data from one or multiple PeCo range units. An easy-to-use application for PC that eases the download of the counting data and simplifies their analysis and graphical representation.
It has multiple charts to easily make presentations, for instance, with comparisons of the data...
Category: Business & Finance / Business Finance
Publisher: Visual Tools S.A., License: Freeware, Price: USD $0.00, File Size: 3.3 MB
Platform: Windows
DealBook 360 has more than enough features, charting tools, indicators and news to help you trade.
DealBook 360 has more than enough features, Charting tools, indicators and news to help you trade.
Identify trends with over 85 technical indicators, eight chart types and a wide range of timeframes.
Organize your trading space with custom layouts, so the platform is familiar each time you log in.
Category: Business & Finance / Business Finance
Publisher: Global Forex Trading, License: Freeware, Price: USD $0.00, File Size: 25.9 MB
Platform: Windows

Obtain data from images of graphs scanned from articles or available as image. Import the Graph into ScanIt from a scanner or file, or from the clipboard. Define locations of the Graph's axes by indicating known points. Extract data from the Graph by manually picking points, by scanning for points or by scanning along curves. Copy the scanned data to Excel or export data to...
Category: Home & Education / Science
Publisher: amsterchem, License: Freeware, Price: USD $0.00, File Size: 6.1 MB
Platform: Windows
iDownloader - FX is a forex data download program for windows.
iDownloader - FX is a forex data download program for windows.
Features:
-iDownloader is a freeware offered to public
-It is designed to help users download end-of-day forex data
-These data are made available and freely accessible to public from websites in the internet
-Data would be automatically converted, rearranged and stored as individual price...
Category: Business & Finance / Business Finance
Publisher: Acrotec, License: Freeware, Price: USD $0.00, File Size: 2.6 MB
Platform: Windows
Free Stock Charting Software with historical charts, technical analysis indicators and news.
Free Stock Charting Software with historical charts, technical analysis indicators and news. We have taken the open source eclipse trade and cleaned up a version specific to news and charts with technical analysis.
Category: Business & Finance / Business Finance
Publisher: pennystocknet.com, License: Freeware, Price: USD $0.00, File Size: 26.7 MB
Platform: Windows, Vista
TradeDesk™ is a personal trading environment for charting, market information and Forex trading.
TradeDesk™ is a personal trading environment for Charting, market information and Forex trading. You can create and save multiple Layouts that suit different market scenarios or trading styles.The platform can help you with your investment plans and financial profits.
Category: Business & Finance / Business Finance
Publisher: Easy-Forex, License: Freeware, Price: USD $0.00, File Size: 672.2 KB
Platform: Windows
With Chart FX Lite for .NET, Visual Studio®.NET Windows Forms developers can employ (for free) many of the powerful features available from the most respected technology in the component industry.
Software FX is offering a free Charting solution for Windows Forms created with Visual Studio.Net or C# Builder. With Chart FX Lite for .NET you will be able to...
Category: Software Development / Misc. Programming
Publisher: Software FX, License: Freeware, Price: USD $0.00, File Size: 2.3 MB
Platform: Windows
Black Box Chart is a fast and easy to use Flash charting component.
Black Box Chart is a fast and easy to use Flash Charting component. You can easily embed it on your website to display interactive charts.
Category: Web Authoring / Web Design Utilities
Publisher: Black Box Chart, License: Freeware, Price: USD $0.00, File Size: 258.0 KB
Platform: Windows
Track the effectiveness of taking HGH supplements across 16 metrics with sortable grids and Charting. Easy to use interface to enter and manage data.
Category: Home & Education / Health & Nutrition
Publisher: consumerproductsreview.org, License: Freeware, Price: USD $0.00, File Size: 1.0 MB
Platform: Windows, Mac, Vista
Freeware
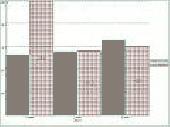
Free Graph Generator is a simple bar chart generation tool that lets you create custom bar charts of any size. Edit bar color, bar width, bar title, and bar side label properties.
Category: Home & Education / Mathematics
Publisher: Innovative Creations Software, License: Freeware, Price: USD $0.00, File Size: 16.5 MB
Platform: Windows
Freeware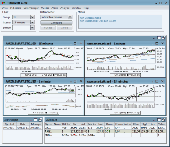
Stock Charting and technical analysis Software with a user-friendly interface targeted for stock investors and realtime traders. Supported dataproviders are Yahoo and Interactive Brokers. With the easy to use script language, you can create your own backtests, indicators, screener, real-time alerts and drawing tools! While you are backtesting, TickInvest creates a history of your...
Category: Business & Finance / Applications
Publisher: Erich Behmen, License: Freeware, Price: USD $0.00, File Size: 25.9 MB
Platform: Windows
Freeware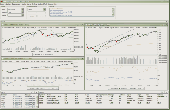
Stock Charting and technical analysis Software with a user-friendly interface targeted for stock investors and realtime traders. Supported dataproviders are Yahoo and Interactive Brokers.With the easy to use script language, you can create your own backtests, indicators, screener, real-time alerts and drawing tools! While you are backtesting, TickInvest creates a history of your...
Category: Business & Finance / Business Finance
Publisher: Erich Behmen, License: Freeware, Price: USD $0.00, File Size: 27.4 MB
Platform: Windows
Biorhytm is a small application that generates your biorhytm status.
Biorhytm is a small application that generates your biorhytm status.
Enter your birthday and a Graph will reveal your
bio health, with charts and lines displaying your physical, intellectual and emotional state as well. You can save result Graph to BMP file.
Category: Home & Education / Astrology & Numerology
Publisher: aOlej, License: Freeware, Price: USD $0.00, File Size: 389.0 KB
Platform: Windows
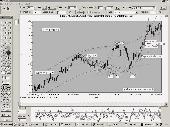
QChartist is a free Charting Software to do technical analysis on any data like Forex, Stocks. It helps to make market forecasts with the help of technical objects and indicators. You can draw geometrical shapes on your charts or plot programmable indicators from your data. It is also possible to filter or merge data. It has built-in astro indicators and realtime quotes. It is...
Category: Business & Finance / Business Finance
Publisher: Julien Moog, License: Freeware, Price: USD $0.00, File Size: 1.1 MB
Platform: Windows, Other
iTraffic Monitor is a network monitor and reporting tool.
iTraffic Monitor is a network monitor and reporting tool. It provides real time Graph of network traffic. Detailed stats provide daily/weekly/monthly/yearly stats.
Main features:
- Monitor and review your Internet or network bandwidth usage with ease.
- How fast your internet connection? We can Graph it for your review.
- How much data do yo u...
Category: Internet / Monitoring
Publisher: Charles DeWeese, License: Freeware, Price: USD $0.00, File Size: 1.1 MB
Platform: Windows
DynoVision Software is a set of tools wrapped up into one application that makes tuning your car easier than ever. You get to see instantly where you have gained power and torque from your modifications, be them mechanical or changes to your map.
If you are running DynoVision on a netbook, double click on the dyno Graph to pop-out the Graph into a separate window -...
Category: Home & Education / Miscellaneous
Publisher: Boa Software, License: Freeware, Price: USD $0.00, File Size: 354.0 KB
Platform: Windows
This free program plots in realtime all data sent and received using the Dial-Up Networking Adapter and Modem. Shows separate sent, received, send rate, received rate, peaks and totals. Five graphs and statistics. Animated System Tray Icon. Allows you to change colours, Graph size, sample seconds, 3D Graph, axis and more. Full automated self-upgrade. Autostart with Win95/98. Now...
Category: Internet / Dial-up & Connectivity
Publisher: Ashok Kumar Parmar, License: Freeware, Price: USD $0.00, File Size: 819.2 KB
Platform: Windows
TI-Graph LINK for Windows is a Windows-based integrated communication link and data manager for the PC.
Main features:
· Transfer data between the calculator and a PC.
· Save TI-83 Plus screen images on the PC for use in word processing, desktop publishing, or page-layout applications.
· Print TI-83 Plus screen images.
...
Category: Utilities / Misc. Utilities
Publisher: Texas Instruments, Inc., License: Freeware, Price: USD $0.00, File Size: 1.2 MB
Platform: Windows
Solid Signals gives you signals during trading hours to buy/sell scrips or commodities with stop loss and target levels. With very good accuracy it helps you to take a call on the market. Technical Analysis based signals. It also has Charting facility which helps to study the scrips properly with the tools. Screener facility allows to filter buy and sell signals generated during the day.
Category: Business & Finance / Auction Tools
Publisher: Chirayu Software Solutions, License: Freeware, Price: USD $0.00, File Size: 441.0 KB
Platform: Windows
DigiGraph 2 is a professional art tool that gives you digital graph paper to draw on.
DigiGraph 2 is a professional art tool that gives you digital Graph paper to draw on. With a full range of drawing tools, an easy to use interface, and supporting unlimited Undo's so you can back track a drawing all the way back to a blank page, DigiGraph 2 is a powerful tool to add to your creative Software collection.
Category: Multimedia & Design / Multimedia App's
Publisher: KnightTrek Productions 2008, License: Freeware, Price: USD $0.00, File Size: 1.7 MB
Platform: Windows
The Library GraphDiag is intended for building Graph and diagrams on HBITMAP, surface DirectDraw and in file BMP format. The Library can build the graphs on entered text line and diagrams, as from tables, which format is provided by developer, so and from files HTML-format and from XLS files Excel. Given version first and is not deprived defect and restrictions. The Restrictions are of...
Category: Software Development / Components & Libraries
Publisher: Kruchinin Aleksandr, License: Freeware, Price: USD $0.00, File Size: 67.0 KB
Platform: Windows
Freeware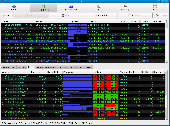
Tixati is a free and easy to use bittorrent client featuring detailed views of all seed, peer, and file transfer properties. Also included are powerful bandwidth Charting and throttling capabilities, and a full DHT implementation. Features: * 100% compatible bit-torrent client * Windows and Linux-GTK native versions available * detailed user interface, with views of...
Category: Internet / File Sharing
Publisher: Tixati Software Inc., License: Freeware, Price: USD $0.00, File Size: 2.4 MB
Platform: Windows
Atlantis Schema Surf is our SQL dependency & live entity ER diagram tool - it is a free animated graphing tool which allows you to easily visualize the dependencies between the objects in your SQL Server databases in a live entity ER diagram.
Schema Surf, like it's counterpart Data Surf, contains a "Surf Graph" which allows you to easily view an object and the...
Category: Business & Finance / Database Management
Publisher: Atlantis Interactive UK Ltd., License: Freeware, Price: USD $0.00, File Size: 7.4 MB
Platform: Windows
With over 140 technical indicators and tools, PhoenixAI is a formidable charting application.
With over 140 technical indicators and tools, PhoenixAI is a formidable Charting application. But that's only the tip of the iceberg. You can also create and edit unlimited watch lists, bring up a stock's overview with the 'Symbol Profile' screen, display market depth, or get a sense of the whole market with the 'Market Mosaic' screen. You can search for...
Category: Business & Finance / Business Finance
Publisher: Aerarius Indicium Pty Ltd, License: Freeware, Price: USD $0.00, File Size: 102.8 KB
Platform: Windows
Freeware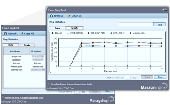
The ManageEngine FREE Ping tool is a simple yet powerful tool with an elegant UI that helps to issue ping requests to "Multiple IP Addresses" in a single instance. And can find the health of the sever continuously for a maximum of 10 hosts. The ping data such as Ipaddress, RoundTripTime, Time To Live (Ttl), Buffer Size and the status are shown in a table. The ManageEngine Free ping tool gives...
Category: Internet / Tools & Utilities
Publisher: ZOHO Corporation, License: Freeware, Price: USD $0.00, File Size: 1.5 MB
Platform: Windows
Exclusive Forex trading Tools Package in one Software called "Simple Forex Toolbar", include many important tools: live forex market news, daily and weekly analysis reports, fundamental and technical analysis, forex calculators, built-in forex tv and radio, live forex charts and news, economic calenders, forex movers and shakers, forex daily hi/low, forex education ebooks, advanced...
Category: Business & Finance / Applications
Publisher: Simple Forex soft, License: Freeware, Price: USD $0.00, File Size: 1.1 MB
Platform: Windows
WTides is a free program that uses harmonics data to predict tide heights at many locations throughout the World, and displays a Graph of the results according to the time zone of the target location. The tide Graph can be overlaid with a solunar chart to give an interesting version of the Maori Fishing Calendar. The program runs on any version of Microsoft Windows from Windows 95.
Category: Multimedia & Design / Digital Media Editors
Publisher: Managing Data Resources (NZ) Ltd, License: Freeware, Price: USD $0.00, File Size: 601.9 KB
Platform: Windows
FCharts SE is a free stock Charting program which will import price data from a wide range of sources, displaying it as OHLC, Candlestick and Line charts. It has a number of built-in indicators (MACD, RSI, Exponential and Standard Moving Averages), or you can write your own with the inbuilt formula language and display them as standalone charts or overlays. You can draw trend lines with...
Category: Business & Finance / Business Finance
Publisher: Spacejock Software, License: Freeware, Price: USD $0.00, File Size: 3.1 MB
Platform: Windows, Vista