Free Downloads: Graph Reporting
License: All | Free
iTraffic Monitor is a network monitor and reporting tool.
iTraffic Monitor is a network monitor and Reporting tool. It provides real time Graph of network traffic. Detailed stats provide daily/weekly/monthly/yearly stats.
Main features:
- Monitor and review your Internet or network bandwidth usage with ease.
- How fast your internet connection? We can Graph it for your review.
- How much data do yo...
Category: Internet / Monitoring
Publisher: Charles DeWeese, License: Freeware, Price: USD $0.00, File Size: 1.1 MB
Platform: Windows
Graph Studio is the open source graph drawing/processing software.
Graph Studio is the open source Graph drawing/processing software. It allows users to build and process highly customizable graphs.
Category: Multimedia & Design
Publisher: sourceforge.net, License: Freeware, Price: USD $0.00, File Size: 118.0 KB
Platform: Windows, Mac, Vista
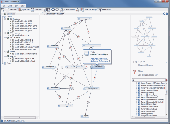
Graph constructs, visualizes and modifies graphs as well as calculates measures and layouts.
Graph constructs, visualizes and modifies graphs as well as calculates measures and layouts.
CoSBiLab Graph can construct, visualize and modify graphs as well as calculate measures and layouts. CoSBiLab Graph can import and export data in a variety of formats, among which the reaction network generated by the beta WorkBench.
Category: Multimedia & Design / Multimedia App's
Publisher: CoSBi, License: Freeware, Price: USD $0.00, File Size: 3.1 MB
Platform: Windows
DataPlot is a program where you can import your time based data and graph it.
DataPlot is a program where you can import your time based data and Graph it.You can move easily back and forward in user defined time window, allows individual time setting for each Graph, values read directly in Graph by dragging mouse over the curve and much more
Category: Multimedia & Design / Multimedia App's
Publisher: CBIM, License: Freeware, Price: USD $0.00, File Size: 311.0 KB
Platform: Windows
Drawing graphs without the right tool is simply difficult.
Drawing graphs without the right tool is simply difficult. uDraw(Graph) automates this task for you. Find out how uDraw(Graph) creates your flow charts, diagrams, hierarchies or structure visualizations using automatic layout - much faster than with any standard drawing program. With the API, uDraw(Graph) can even be embedded in your own programs as a visualization component.
Category: Multimedia & Design / Image Editing
Publisher: University Bremen, FB3, Germany, License: Freeware, Price: USD $0.00, File Size: 2.6 MB
Platform: Windows
The WebViewer plug-in enables Windows users whether or not they have SigmaPlot to explore the data used to create the Graph.
Using the WebViewer plug-in with your Web browser window you can:
- View the data used to create the Graph
- Print a Graph in a web document at full resolution
- Zoom in and out of a Graph
- Grab and...
Category: Multimedia & Design / Graphics Viewers
Publisher: SYSTAT Software Inc., License: Freeware, Price: USD $0.00, File Size: 12.6 MB
Platform: Windows
With The Option Strategy Builder you could pick up an option and place it directly to the return Graph. As with the online tool, just drag and drop the option on the Graph, and build your strategy. Using your mouse, the options can be easily moved on the Graph to different strike prices, and to different expiration dates.
With this program you can manage your...
Category: Multimedia & Design / Multimedia App's
Publisher: SamoaSky, License: Freeware, Price: USD $0.00, File Size: 3.1 MB
Platform: Windows

Archim is a program for drawing the graphs of all kinds of functions. You can define a Graph explicitly and parametrically, in polar and spherical coordinates, on a plane and in space (surface). Archim will be useful for teachers and students, as well as for everyone who is interested min geometry. With Archim, you will draw the Graph of any function and form, just use your...
Category: Home & Education
Publisher: Stochastic Lab, License: Freeware, Price: USD $0.00, File Size: 479.6 KB
Platform: Windows
Graph-A-Ping allows you to visually see the ping latency between ping times.
Graph-A-Ping allows you to visually see the ping latency between ping times. The bigger the gap between one ping to another allows you to spot possible network bottle neck.
This tool is actually an applet part of Glass Net Networks monitoring console.
Category: Internet / Misc. Plugins
Publisher: Mataluis.Com, License: Freeware, Price: USD $0.00, File Size: 2.1 MB
Platform: Windows
Graph Extract is a program for digitizing plots.
Graph Extract is a program for digitizing plots. Using either manual or automated approaches, this program provides a means to easily extract numeric data from plots. The resulting X-Y data can be printed or replotted, or it can be saved in Excel file for
Category: Multimedia & Design
Publisher: quadtechassociates.com, License: Freeware, Price: USD $0.00, File Size: 446.0 KB
Platform: Windows
Graph visualization is a way of representing structural information as diagrams of abstract graphs and networks. Automatic Graph drawing has many important applications in software engineering, database and web design, networking, and in visual interfaces
Category: Multimedia & Design
Publisher: graphviz.org, License: Freeware, Price: USD $0.00, File Size: 26.6 MB
Platform: Windows, Mac, Vista
The NetGraph – network monitor 2.
The NetGraph – network monitor 2.0 is a software network-monitoring program that enables users to see at a glance the activities on their networks including the volumes of traffic with four simple Graph mode indicators.
The program works on any Windows’ network connection and NetGraph – network monitor 2.0’s four modes include 2 snapshot modes and 2...
Category: Internet / Monitoring
Publisher: Nikola Dachev, License: Freeware, Price: USD $0.00, File Size: 0
Platform: Windows
MathTrax is a graphing tool for middle school and high school students to Graph equations, physics simulations or plot data files.
The graphs have descriptions and sound so you can hear and read about the Graph. Blind and low vision users can access visual math data and Graph or experiment with equations and datasets.
Category: Business & Finance / Applications
Publisher: The MathTrax Team, License: Freeware, Price: USD $0.00, File Size: 21.0 MB
Platform: Windows
 Freeware
myDBR is an innovative web based Reporting solution for MySQL and Microsoft SQL Server with support for latest smartphones (Android, iPhone, and Symbian). myDBR Reporting solution brings unparalleled speed of authoring even the most complex reports. By automating most of the work needed on traditional Reporting systems, myDBR increases productivity and offers a cost...
Category: Business & Finance / Database Management
Publisher: Nocsos Ltd, License: Freeware, Price: USD $0.00, File Size: 1.4 MB
Platform: Windows, Mac, Linux
RJS Graph produces professional scientific and mathematical graphs.
RJS Graph produces professional scientific and mathematical graphs. You may study the data with a wide range of data analysis tools. Features include the ability to plot data and equations, fit best fit curves and splines, and display fitted best fit curve parameters. Data can be pasted from a spreadsheet or imported from a text file using a wizard.
Category: Home & Education / Mathematics
Publisher: RJS, License: Freeware, Price: USD $0.00, File Size: 3.7 MB
Platform: Windows
T&D Graph has been designed as a user friendly software which brings users even more effective tools for the management and analysis of data recorded by T&D Data Loggers. It contains a variety of useful functions including the ability to read and merge multiple data files and display recorded data in Graph and/or list form.
Category: Software Development / Misc. Programming
Publisher: T&D CORPORATION, License: Freeware, Price: USD $0.00, File Size: 11.3 MB
Platform: Windows
Function Analyzer is a program that draws the Graph of a function with one variable declared by the user. The operators used to build the mathematical expression are the usual ones used in software calculators: * for multiplying, / for dividing, ^ for power and so on. Parentheses can be used to group terms in your expression. Trigonometric functions are also supported, along with a few...
Category: Home & Education / Mathematics
Publisher: Lorenzi Davide, License: Freeware, Price: USD $0.00, File Size: 1.3 MB
Platform: Windows
JGraph is the leading Open Source Java Graph Visualization Library.
JGraph is the leading Open Source Java Graph Visualization Library. It follows Swing design patterns to provide an API familiar to Swing programmers and functionality that provides a range of features. Graph visualization is a central requirement for applications such as workflow editors, computer and telecommunication networks display, flowcharts, VLSI and CAD, business process...
Category: Software Development / Components & Libraries
Publisher: JGraph Ltd, License: Freeware, Price: USD $0.00, File Size: 136.0 KB
Platform: Windows, Linux, Mac

Obtain data from images of graphs scanned from articles or available as image. Import the Graph into ScanIt from a scanner or file, or from the clipboard. Define locations of the Graph's axes by indicating known points. Extract data from the Graph by manually picking points, by scanning for points or by scanning along curves. Copy the scanned data to Excel or export data to...
Category: Home & Education / Science
Publisher: amsterchem, License: Freeware, Price: USD $0.00, File Size: 6.1 MB
Platform: Windows
VirusCop is a simple freeware Windows program for Reporting virus spam, erroneous e-mail bounces and other spam. It allows you to paste in the headers from virus spam and the relevant ISP e-mail contacts. If you prefer, VirusCop can even automatically find the email complaint contacts for you. There is also a bulk Reporting feature to automatically send spam reports for large...
Category: Internet
Publisher: VirusCop.org, License: Freeware, Price: USD $0.00, File Size: 772.8 KB
Platform: Windows
WildPackets Compass Live offers high-level network statistics, which you can Graph, dynamically interact with, and report on, showing what your wired and wireless networks are doing over any slice of time. With its unique ability to aggregate traffic from multiple segments, both wired and wireless, Compass Live provides real-time visibility and post-capture insight into your network.
Category: Internet / Misc. Plugins
Publisher: WildPackets, License: Freeware, Price: USD $0.00, File Size: 37.0 MB
Platform: Windows
Freeware
Free Graph Generator is a simple bar chart generation tool that lets you create custom bar charts of any size. Edit bar color, bar width, bar title, and bar side label properties.
Category: Home & Education / Mathematics
Publisher: Innovative Creations Software, License: Freeware, Price: USD $0.00, File Size: 16.5 MB
Platform: Windows
Biorhytm is a small application that generates your biorhytm status.
Biorhytm is a small application that generates your biorhytm status.
Enter your birthday and a Graph will reveal your
bio health, with charts and lines displaying your physical, intellectual and emotional state as well. You can save result Graph to BMP file.
Category: Home & Education / Astrology & Numerology
Publisher: aOlej, License: Freeware, Price: USD $0.00, File Size: 389.0 KB
Platform: Windows
PeCo-Graph is the software for the procurement and graphical visualisation of the counting data from one or multiple PeCo range units. An easy-to-use application for PC that eases the download of the counting data and simplifies their analysis and graphical representation.
It has multiple charts to easily make presentations, for instance, with comparisons of the data acquired in...
Category: Business & Finance / Business Finance
Publisher: Visual Tools S.A., License: Freeware, Price: USD $0.00, File Size: 3.3 MB
Platform: Windows
This free program plots in realtime all data sent and received using the Dial-Up Networking Adapter and Modem. Shows separate sent, received, send rate, received rate, peaks and totals. Five graphs and statistics. Animated System Tray Icon. Allows you to change colours, Graph size, sample seconds, 3D Graph, axis and more. Full automated self-upgrade. Autostart with Win95/98. Now...
Category: Internet / Dial-up & Connectivity
Publisher: Ashok Kumar Parmar, License: Freeware, Price: USD $0.00, File Size: 819.2 KB
Platform: Windows
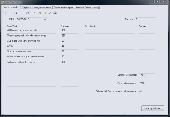
The Reporting Services Job Monitor (RSJM) allows you to monitor the status of long running reports in Microsoft Reporting Services or just see who is looking at what reports in real time.
Long running reports (anything more than about 10 mins) when executed as a snapshot either cause the Reporting Services front-end to time out, or to return you the Home page -...
Category: Utilities / System Utilities
Publisher: Tom Morgan, License: Freeware, Price: USD $0.00, File Size: 476.5 KB
Platform: Windows
The Library GraphDiag is intended for building Graph and diagrams on HBITMAP, surface DirectDraw and in file BMP format. The Library can build the graphs on entered text line and diagrams, as from tables, which format is provided by developer, so and from files HTML-format and from XLS files Excel. Given version first and is not deprived defect and restrictions. The Restrictions are of...
Category: Software Development / Components & Libraries
Publisher: Kruchinin Aleksandr, License: Freeware, Price: USD $0.00, File Size: 67.0 KB
Platform: Windows
Atlantis Schema Surf is our SQL dependency & live entity ER diagram tool - it is a free animated graphing tool which allows you to easily visualize the dependencies between the objects in your SQL Server databases in a live entity ER diagram.
Schema Surf, like it's counterpart Data Surf, contains a "Surf Graph" which allows you to easily view an object and the...
Category: Business & Finance / Database Management
Publisher: Atlantis Interactive UK Ltd., License: Freeware, Price: USD $0.00, File Size: 7.4 MB
Platform: Windows
WTides is a free program that uses harmonics data to predict tide heights at many locations throughout the World, and displays a Graph of the results according to the time zone of the target location. The tide Graph can be overlaid with a solunar chart to give an interesting version of the Maori Fishing Calendar. The program runs on any version of Microsoft Windows from Windows 95.
Category: Multimedia & Design / Digital Media Editors
Publisher: Managing Data Resources (NZ) Ltd, License: Freeware, Price: USD $0.00, File Size: 601.9 KB
Platform: Windows
In order to use linear barcode fonts in Reporting Service,
you need to download the support assembly from our web site.
The assembly wraps several calls in managed code. Currently we release the code
in a separate package. However, we expect to add the Reporting Service support
into the future releases of Morovia Font Tools,
which is included in every...
Category: Business & Finance / Inventory Systems
Publisher: Morovia Corporation, License: Freeware, Price: USD $0.00, File Size: 325.0 KB
Platform: Windows
GraphSight Junior is an easy to use freeware handy 2D math-graphing program.
GraphSight Junior is an easy to use freeware handy 2D math-graphing program. It was originally designed to help students and teachers satisfy their day-after-day math plotting needs. It makes it easy to plot and explore common Y(X) = F(X) Cartesian graphs, set text labels on the coordinate plane, zoom or shift a Graph with just a single click & move of mouse. The resulting picture...
Category: Home & Education / Miscellaneous
Publisher: CradleFields.com, License: Freeware, Price: USD $0.00, File Size: 393.0 KB
Platform: Windows
GraphTablet is a handy application to create blank graph paper.
GraphTablet is a handy application to create blank Graph paper. It doesn’t have any help file, but it is very easy to use and can be helpful for students, pupils and even for preschool age kids as a graphic coloring paper.
GraphTablet offers you a clear interface and has only one window. It consists of the “Preview” window on the right and all controls and...
Category: Multimedia & Design / Multimedia App's
Publisher: Michael Eve, License: Freeware, Price: USD $0.00, File Size: 272.9 KB
Platform: Windows
XYGraph is a native . NET charting component showing data in a cartesian graph (X,Y).
Controls from componentXtra gives royalty free software integration. Both the free and purchased products includes sample code (VB and C#). .
Category: Software Development
Publisher: componentXtra, License: Freeware, Price: USD $0.00, File Size: 390.6 KB
Platform: Windows
Freeware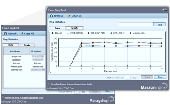
The ManageEngine FREE Ping tool is a simple yet powerful tool with an elegant UI that helps to issue ping requests to "Multiple IP Addresses" in a single instance. And can find the health of the sever continuously for a maximum of 10 hosts. The ping data such as Ipaddress, RoundTripTime, Time To Live (Ttl), Buffer Size and the status are shown in a table. The ManageEngine Free ping tool gives...
Category: Internet / Tools & Utilities
Publisher: ZOHO Corporation, License: Freeware, Price: USD $0.00, File Size: 1.5 MB
Platform: Windows
DigiGraph 2 is a professional art tool that gives you digital graph paper to draw on.
DigiGraph 2 is a professional art tool that gives you digital Graph paper to draw on. With a full range of drawing tools, an easy to use interface, and supporting unlimited Undo's so you can back track a drawing all the way back to a blank page, DigiGraph 2 is a powerful tool to add to your creative software collection.
Category: Multimedia & Design / Multimedia App's
Publisher: KnightTrek Productions 2008, License: Freeware, Price: USD $0.00, File Size: 1.7 MB
Platform: Windows
The College & University Deans and Chairs Reporting Database 1.
The College & University Deans and Chairs Reporting Database 1.0 is a report application that aggregates college reports on faculty activity and productivity and allows viewing through multiple security access portals for Deans, Chairs, Faculty, and admin
Category: Business & Finance / Database Management
Publisher: cecs.ucf.edu, License: Freeware, Price: USD $0.00, File Size: 1.2 MB
Platform: Windows, Mac, 2K, 2K3
My Diet Diary is a program you install on your PC, it helps you track your weight lose and calorie intake. Very simple and easy to use yet draws very informative charts and graphs to show how you are doing.
Features:
Very simple to set up and use, once installed it will take you minutes to be up and running
Track your weight by entering your regular weigh in, the program will draw a...
Category: Home & Education / Health & Nutrition
Publisher: Julie Stone, License: Freeware, Price: USD $0.00, File Size: 1024 B
Platform: Windows
TI-Graph LINK for Windows is a Windows-based integrated communication link and data manager for the PC.
Main features:
· Transfer data between the calculator and a PC.
· Save TI-83 Plus screen images on the PC for use in word processing, desktop publishing, or page-layout applications.
· Print TI-83 Plus screen images.
...
Category: Utilities / Misc. Utilities
Publisher: Texas Instruments, Inc., License: Freeware, Price: USD $0.00, File Size: 1.2 MB
Platform: Windows
Freeware
Logon events is one the most critical type of audit data required for security analysis and compliance audits. Netwrix Logon Reporter is a freeware product that extends the built-in event management capabilities in Active Directory domain controllers. The product adds centralized event consolidation and Reporting capabilties and removes many limitation and drawbacks of built-in...
Category: Utilities / Network
Publisher: Netwrix Corporation, License: Freeware, Price: USD $0.00, File Size: 2.3 MB
Platform: Windows
Instantly analyse compare sales and income data and view in graph format.
Instantly analyse compare sales and income data and view in Graph format. Compare income/sales from companies, clients, products and services, marketing tools, sales reps and demographics. Instantly view closing ratios. Create invoices. Export to Excel and Word. Email database for access anywhere.
Category: Business & Finance / Applications
Publisher: ClickOk Ltd, License: Freeware, Price: USD $0.00, File Size: 1.6 MB
Platform: Windows
DynoVision Software is a set of tools wrapped up into one application that makes tuning your car easier than ever. You get to see instantly where you have gained power and torque from your modifications, be them mechanical or changes to your map.
If you are running DynoVision on a netbook, double click on the dyno Graph to pop-out the Graph into a separate window - this...
Category: Home & Education / Miscellaneous
Publisher: Boa Software, License: Freeware, Price: USD $0.00, File Size: 354.0 KB
Platform: Windows
KeyCounter provides a way of keeping track of when you've been active on your PC during the day.
KeyCounter provides a way of keeping track of when you've been active on your PC during the day. It does pretty much what it says - counts the number of key strokes you make every minute and records that information, along with whether the mouse has moved.
KeyCounter can then be used to browse the files, and display a Graph of when you were at your most busy. It details...
Category: Utilities / Launchers
Publisher: tApp Systems, License: Freeware, Price: USD $0.00, File Size: 26.5 KB
Platform: Windows
This program will analyze hurricane model files (A-Deck) that regional centers produce for Invest and active systems world-wide.
Some of the features available:
-Fixes the problem with the bottom of the Graph not showing up on the screen with some screen resolutions.
-Add an auto update feature for the software. When a new version is available, it will be...
Category: Business & Finance / Business Finance
Publisher: Extreme Weather, License: Freeware, Price: USD $0.00, File Size: 3.4 MB
Platform: Windows
PyPlotter is an open source 2D graph plotting package for Python and Jython.
PyPlotter is an open source 2D Graph plotting package for Python and Jython. It was primarily written for use in the CoopSim package. If you do not rely on Jython support or any other of PyPlotter's special featurs (see key features list below), you will probably be better off with one of the more common Python plotting packages like Matplotlib or ReportLab, both of which offer much...
Category: Home & Education / Miscellaneous
Publisher: Eckhart Arnold, License: Freeware, Price: USD $0.00, File Size: 116.7 KB
Platform: Windows
SBHistogram generates simple histograms from simple ASCII data files.
SBHistogram generates simple histograms from simple ASCII data files. It's a simple tool designed to be easy to use.
A histogram is a chart in which data values in counted and placed into buckets. For example, let's assume you want to do a histogram of peoples ages. Then you might want to use buckets such as 1-10 years, 11-20 years, 21-30 years, etc. Each bucket counts the...
Category: Multimedia & Design / Multimedia App's
Publisher: SB-Software, License: Freeware, Price: USD $0.00, File Size: 604.0 KB
Platform: Windows
Whistle a melody and watch this program graph the pitch in real time.
Whistle a melody and watch this program Graph the pitch in real time. The Frequency Analyzer technically speaking performs a Fast Fourier Transform of the sound (you need a sound card and a microphone to use this program). What it means is that it analyzes your voice and splits it into its component frequencies. Watch patterns of speech, the harmonics of vowels and the noise of...
Category: Audio / Utilities & Plug-Ins
Publisher: Reliable Software, License: Freeware, Price: USD $0.00, File Size: 73.0 KB
Platform: Windows
BitMeter 2 is a bandwidth meter, it allows you to visually monitor your internet connection by displaying a scrolling Graph that shows your upload and download speed over time. BitMeter is freeware - ie. it is given away completely free of charge, there is no trial period, no time-limited features, no spyware, and no adware, guaranteed. BitMeter displays a coloured...
Category: Internet
Publisher: Codebox Software, License: Freeware, Price: USD $0.00, File Size: 1017.3 KB
Platform: Windows
Freeware
Origramy is a XML-driven flash Graph component specially made for building, editing and displaying graphs and diagrams of various kinds. In two modes of the component webmasters and developers can fast and easily create, modify and present any graphs, presentations, flowcharts, organization structures, algorithms layouts, fluxograms, specific diagrams, objects references map, etc. The...
Category: Web Authoring / Flash Utilities
Publisher: Origramy, License: Freeware, Price: USD $0.00, File Size: 781.4 KB
Platform: Windows, Mac, Linux
AltovaXML® 2011 Reporting Edition is an advanced XML standards processor that includes the Altova XSLT 1.0 and XSLT 2.0 engines, XQuery engine, XBRL validator, and XML validator, plus support for rendering charts in XSLT or XQuery to display XML data.AltovaXML® 2011r3 sp1 Reporting Edition is a an executable file. It is available in English and German-language versions for...
Category: Utilities / Misc. Utilities
Publisher: Altova, License: Freeware, Price: USD $0.00, File Size: 14.5 MB
Platform: Windows
BitMeter 2 is a bandwidth meter, it allows you to visually monitor your internet connection by displaying a scrolling Graph that shows your upload and download speed over time. BitMeter is freeware - ie. it is given away completely free of charge, there is no trial period, no time-limited features, no spyware, and no adware, guaranteed. BitMeter displays a coloured Graph showing...
Category: Internet / Monitoring
Publisher: Codebox Software, License: Freeware, Price: USD $0.00, File Size: 1013.8 KB
Platform: Windows