OLAP Statistics for SharePoint Screenshot
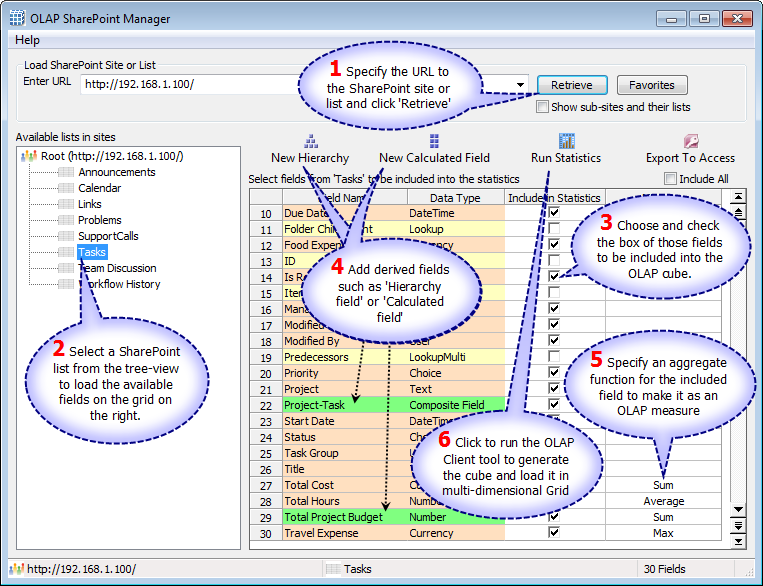
OLAP Statistics & Reporting for SharePoint enables you to connect to a SharePoint list, task or calendar and explore data in a multi-dimensional grid, pivot tables, filters, and graph or chart view. You can run this OLAP analysis tool on on each SharePoint list, with its own unique set of fields. You can specify any field as the measure using functions such as sum, count, distinct count, maximum, minimum etc, and use this against other fields to aggregate and summarized statistics. Now it?s easier than ever to spot new trends and discover unknown problems in your data flow. Save and share reports as PDF, JPEG, HTML or PNG formats.
Back to OLAP Statistics for SharePoint Details page
OLAP Statistics for SharePoint Related
- MAPILab Statistics For SharePoint
- Olap Ms Access
- Olap Underground
- Olap Screenshots
- Olap Report
- Activex Olap
- Olap Application
- Olap Reporting
- Olap Charting
- Olap Delphi
New software of Business & Finance, Applications
DeskConnect - Machine learning for seamless capture, processing, and distribution of documents. Effortlessly integrate with various platforms, ensuring secure, efficient, and error-free handling. Perfect for any scale, from individual users to large enterprises.
imyPass iPassGo for Mac - As a safe iOS unlocker, imyPass iPassGo for Mac is able to unlock the screen passcode, Screen Time passcode, and remove Apple ID from your iPhone, iPad, and iPod.
ActivTrak for Windows - ActivTrak is the only cloud-based user activity monitoring, UAM, solution that captures user data in the digital workplace to help teams improve security, compliance and productivity.
JobCard 2 - Looking for the ideal workshop software? JobCard 2 has you covered for car, computer, machine repairs, and more. Free, simple, customizable, with invoicing and emailing features.
ActivTrak for MacOS - ActivTrak is the only cloud-based user activity monitoring, UAM, solution that captures user data in the digital workplace to help teams improve security, compliance and productivity.
SSuite NetVine LAN Suite - This revolutionary new software application is the first ever to embrace true stand-alone communications processing in a local area networking environment that includes LAN and Wi-Fi. This application is also completely and absolutely portable!
All File URLs Extractor - All File URLs Extractor v2.7 is a software to extract website links from document files from your computer offline. It support document files as PDF files, Excel (xls / xlsx), Word documents (doc / docx), PowerPoint (ppt / pptx), rtf, xml, txt etc.
JobCard 3 - JobCard 3 offers fast, flexible Service Repair Shop Software with integrated AI for text processing. Suitable for various repair services, it's network-ready and enhances productivity with customized features for invoicing, emails, and more.
SSuite Office Excalibur Release - This office suite introduces some new innovative concepts in interface design and user-friendly application interaction. You get instant system access, top class application design and a cleaner desktop to name a few.
TextSniper - TextSniper is simple and easy to use text recognition tool for your Mac. It extracts any text within selected portion on your screen and turns it into editable text. Easily recognize text from graphics, digital documents and videos.