Nevron SharePoint Vision Screenshot
Nevron Data Visualization technology for Microsoft SharePoint 2007 and 2010 (MOSS and WSS) is designed to provide exceptional reporting and dashboarding features to SharePoint users and IT Professionals. The web parts included in the suite are configured visually and directly in SharePoint environment, through an exhaustive web-based interface.
The web parts can connect to a diverse range of data sources including: databases, SP Lists, BDC and Excel Services. They are equipped with a fast, reliable and flexible data aggregation engine, allowing the authoring of complex dashboards that perform sophisticated data analysis. This, combined with the presentation quality and rich feature set that only Nevron provides, makes these web parts unmatched.
Nevron SharePoint Vision is a turn-key solution for every SharePoint user who is willing to create advanced digital dashboards and reports in SharePoint - quickly, on budget and on time.
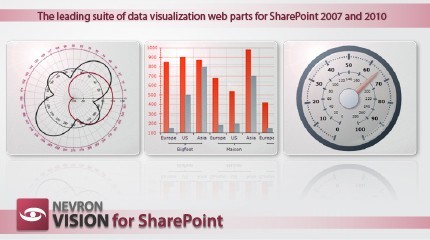
Nevron Chart for SharePoint is an advanced web part, delivering a complete set of 2D and 3D charting types, highly customizable axes, multiple charting areas, legends and titles and a full range of enterprise charting features, driven by pivot data aggregation. This allows the creation of complex pivot charts to be done visually and directly in SharePoint environment.
Nevron Gauge for SharePoint also delivers a complete set of radial and linear gauges, numeric displays and state indicators. This makes possible the modification of complex gauges, tightly integrated with your data, which are manipulated visually and directly in SharePoint environment.
Back to Nevron SharePoint Vision Details page
- Nevron Net Vision
- Nevron Ssrs Vision
- Nevron Chart For Sharepoint
- Nevron Event
- Nevron Diagram
- Nevron Charts
- Nevron Chart
- Nevron Diagram For Net
- Nevron Chart For Net
- Nevron Chart Annotations