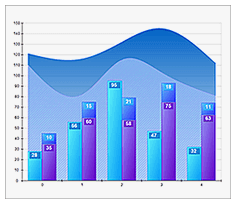
Nevron Chart for .NET Screenshot
Nevron Chart for .NET is designed to be flexible, efficient and extensible. Combining a vast amount of features in an intuitive and straightforward programming model, the component can display virtually any 2D or 3D chart including: Bar, Line, Step Line, Area, Pie, Point, Bubble, Stock, Floating Bar, Radar, Polar, High Low, Mesh Surface, Grid Surface, Shape, Smooth Line, Float Bar, Venn and Error with many variations (such as Scatter XY and XYZ Line, Stacked Bars, etc.).
Other charting features include scrollable axes, integrated legend, chart annotations, watermarks and very extensible chart layout manager. The component also features full AJAX support and Visual Studio design time support with many advanced features such as style editors, allowing you to quickly modify the chart through the visual interface only. The control includes as well and a custom toolbar plus an integrated data grid components, which can come handy in advanced charting applications requiring high degrees of interactivity features.
Back to Nevron Chart for .NET Details page
- Nevron Chart For Net
- Nevron Diagram For Net
- Nevron Net Vision
- Nevron Chart
- Nevron Chart Annotations
- Nevron Chart For Sharepoint
- Net Chart Control Nasosoft Chart
- Chart For Net
- Chart Vb Net
- Vb Net Chart