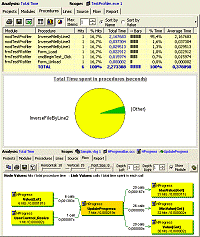
VB Watch Screenshot

Take cover from runtime errors, test, debug and profile your code. VB Watch is 3 tools in one: Profiler, Debugger, and Protector. Increase the quality, stability and performance of your Visual Basic programs. Measure performance. See which procedures are the slowest ones, and which lines or loops are taking up most of the time. Or measure execution times before and after your enhancements. Add advanced error handlers. Error messages can include: error description, procedure name, line number, parameter and variable values, object properties, call stack, screenshot, runtime library versions, and even execution trace procedure by procedure, line by line. EXE debugger! Trace the procedure calls and executed code lines in your compiled apps. Even better, monitor and pause your app. See its status. What line is it on? What procedures were called with what arguments? Call stack? Which objects are alive? Setup breakpoints to your exe files and see what is really happening. Ensure 100% test coverage. Are you sure you tested all your code? VB Watch Profiler records your test sessions as you execute your code. It shows you in red which procedures and lines are still untested.
Back to VB Watch Details page
- For Stock Market Watch Script Watch
- Watch Day Watch Movie
- Watch Tv On
- Changes Watch
- Third Watch
- Watch Cartoon
- Watch Cursors
- Watch Dc Comics Tv
- Tv Watch Program
- Watch Divx
