Free Downloads: Bar Charts Amd Activity Networks
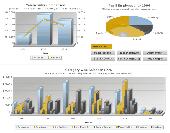
ADSS Charts Control designed to display three types of Charts: Horizontal Bar Chart, Vertical Bar Chart, Pie Chart, key Features: supports Captions and Values.Text can be aligned,control allows to display text information inside and outside chart elements. Chart data can be grouped in Groups. Can be updated in real-time for creating of animated Charts. Control...
Category: Software Development / Components & Libraries
Publisher: Advanced Software Solutions, License: Shareware, Price: USD $47.00, File Size: 716.8 KB
Platform: Windows
JFreeChart is a free Java class library for generating Charts (GNU LGPL). Support is included for: pie Charts, Bar Charts, line Charts, scatter plots, time series Charts, candlestick Charts, high-low-open-close Charts and more. Use in applications, servlets, JSP or applets. Export to PNG, JPEG, PDF, SVG and HTML image maps. Complete...
Category: Software Development
Publisher: Object Refinery Limited, License: Freeware, Price: USD $0.00, File Size: 5.3 MB
Platform: Windows, Linux, Unix
SD-Graph v1.0 is a sophisticated bar graphing system that allows you to create and display colorful bar charts with detailed statistics.
Category: Software Development
Publisher: Spriteworks Developments, License: Demo, Price: USD $14.95, File Size: 18.1 KB
Platform: Unknown
The Exontrol's ExGantt component is the approach to create timeline Charts (also known as Gantt Charts). Gantt chart is a time-phased graphic display of Activity durations. Activities are listed with other tabular information on the left side with time intervals over the bars. Activity durations are shown in the form of horizontal bars. The exGantt component...
Category: Utilities / Misc. Utilities
Publisher: Exontrol, License: Freeware, Price: USD $0.00, File Size: 18.0 MB
Platform: Windows
Bar Chart Creator Software is an application that allows you to create Bar Charts based on numbers and their corresponding labels. You can enter data to each entry manually or simple load labels and numbers from a text file. Once the chart is created, you can print it or save it as a JPG image.
Category: Business & Finance / Business Finance
Publisher: Sobolsoft, License: Shareware, Price: USD $19.99, File Size: 2.5 MB
Platform: Windows
ActiveX/OCX control to draw 2D pie Charts, Bar Charts & line graphs. As well as displaying the graphs they can be exported to file in gif, png, bmp, jpg or pcx format. Output can be exported as binary data for use with web applications, or copied to the clipboard. A comprehensive selection of properties allow control over colours, fonts, formatting and layout. Pie and...
Category: Software Development
Publisher: Chestysoft, License: Demo, Price: USD $60.00, File Size: 976.3 KB
Platform: Windows


 Freeware
MyOra is a free SQL Tool for Oracle database developers and DBAs. This tool is simple, fast and easy to use, requires no installation, no Oracle client and no internet connection. Just download, unzip and start using with a click of the mouse, run SQL queries and Monitor database performance in Real Time. MyOra’s MDI (Multi Document Interface) framework handles multiple sub-windows opened at...
Category: Software Development / Databases & Networks
Publisher: Jayam Systems, LLC, License: Freeware, Price: USD $0.00, File Size: 1.0 MB
Platform: Windows
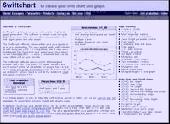
Chart java applet software to generate dynamic Charts and graphs - Bar, line, pie, stacked and grouped Charts in 2D and 3D with a wide range of parameters and chart types. Main features: Charts in 2D/3D, Anti aliasing, Multi language support, Cross browser compatible, Java Script parameter control, Data labels, Contextual data drill down, CSV data sources, Trend...
Category: Multimedia & Design
Publisher: Swiftchart Limited, License: Demo, Price: USD $99.00, File Size: 97.7 KB
Platform: Windows, Mac, Linux, Unix, MS-DOS, AS/400
Chart java applet software to generate dynamic Charts and graphs - Bar, line, pie, stacked and grouped Charts in 2D and 3D with a wide range of parameters and chart types. Main features: Charts in 2D/3D, Anti aliasing, Multi language support, Cross browser compatible, Java Script parameter control, Data labels, Contextual data drill down, CSV data sources, Trend...
Category: Software Development / Tools & Editors
Publisher: Swiftchart Limited, License: Demo, Price: USD $99.00, File Size: 97.0 KB
Platform: Windows, Mac, Linux, Unix, MS-DOS, AS, 400


 Freeware
Free Graph Generator is a simple bar chart generation tool that lets you create custom bar charts of any size. Edit bar color, bar width, bar title, and bar side label properties.
Category: Home & Education / Mathematics
Publisher: Innovative Creations Software, License: Freeware, Price: USD $0.00, File Size: 16.5 MB
Platform: Windows


 Shareware
FusionCharts for Flex is a charting component for Adobe Flex solutions. It helps you create interactive Charts and graphs in your Flex projects. The Charts are powered by FusionCharts v3 framework - the industry leader in Adobe Flash Charting. FusionCharts for Flex offers over 45 chart types spanning both 2D and 3D Charts, including: * Standard Charts like...
Category: Software Development / Components & Libraries
Publisher: InfoSoft Global (P) Ltd., License: Shareware, Price: USD $299.00, ALL1499, File Size: 14.5 MB
Platform: Windows, Mac, Linux, Unix
Chart java applet software to generate dynamic Charts and graphs within JSP, servlets or java applications - Bar, line, pie, stacked and grouped Charts in 2D and 3D with a wide range of parameters and chart types. Main features: Charts in 2D/3D, Anti aliasing, Multi language support, Cross browser compatible, Java Script parameter control, Data labels, Contextual...
Category: Software Development
Publisher: Swiftchart Limited, License: Demo, Price: USD $99.00, File Size: 97.7 KB
Platform: Windows, Mac, Linux, Unix, MS-DOS, AS/400
Chart java applet software to generate dynamic Charts and graphs within JSP, servlets or java applications - Bar, line, pie, stacked and grouped Charts in 2D and 3D with a wide range of parameters and chart types. Main features: Charts in 2D/3D, Anti aliasing, Multi language support, Cross browser compatible, Java Script parameter control, Data labels, Contextual...
Category: Software Development / Tools & Editors
Publisher: Swiftchart Limited, License: Demo, Price: USD $99.00, File Size: 97.0 KB
Platform: Windows, Mac, Linux, Unix, MS-DOS, AS, 400
HanengCharts enables you to easily add customized, dynamic, interactive Charts to your Web site, intranet or Web application. No installation is required on the server, simply upload the small JAR file (80Kb) to the same folder as your Web page, add a few lines of HTML code and you have your first chart. Use any technology that can output HTML (like ASP.Net, ASP, PHP, JSP, ColdFusion...
Category: Internet
Publisher: Haneng Consult, License: Demo, Price: USD $399.00, File Size: 1.0 MB
Platform: Windows, Mac, Linux, Unix
Quantum Charts™ empowers you to easily create and back test trading strategies in minutes with breakthrough technology that analyzes the market for you. Open a chart, click on a Bar, and Quantum Charts provides you with a comprehensive list of true conditions for that Bar.
Select any set of conditions you want to back test and drag them into the patent...
Category: Business & Finance / Business Finance
Publisher: Quantum Trading Technologies, License: Freeware, Price: USD $0.00, File Size: 454.9 KB
Platform: Windows


 Demo
DemoThis COM object / ASP component draws pie and Bar Charts and line graphs on the fly. Output can be streamed to the browser using BinaryWrite, or saved to file. Image types include GIF, PNG, JPG and bitmap. A wide range of properties allow the customisation of colour, size and text style. Built in defaults allow the production of graphs with only a few lines of code. Show...
Category: Web Authoring / Scripts & CGI Tools
Publisher: Chestysoft, License: Demo, Price: USD $60.00, File Size: 594.9 KB
Platform: Windows
Windows Activity Monitor
The Windows Activity Monitor monitors user's Activity on the computer, tracks active windows and processes, allows table and chart visualization.Windows Activity Monitor periodically records foreground window and its process executable to give out various statistics and Charts. You can group windows and/or processes using...
Category: Utilities / Misc. Utilities
Publisher: Archae s.r.o., License: Freeware, Price: USD $0.00, File Size: 1.9 MB
Platform: Windows
FusionCharts Free is a flash charting component that can be used to render data-driven & animated Charts for your web applications and presentations. It is a cross-browser and cross-platform solution that can be used with ASP.NET, ASP, PHP, JSP, ColdFusion, Ruby on Rails, simple HTML pages or even PowerPoint Presentations to deliver interactive and powerful flash Charts. You...
Category: Software Development / Components & Libraries
Publisher: InfoSoft Global (P) Ltd., License: Freeware, Price: USD $0.00, File Size: 2.7 MB
Platform: Windows, Mac, Linux,
Focus in Multi-Core/Multithreading CPU Benchmark software, CPU Rank, Real-time Ranking, Charts, Over-clock test, Intel VS Amd, CPU Mainboard/Motherboard compatibility query.
CoresMark 2010 is a next-generation multi-core processors and parallel processing technology for accurate testing and benchmarking the performance value of the new software
Category: Utilities / System Utilities
Publisher: NMicro Technology Co., Ltd. (Taiwan Company), License: Freeware, Price: USD $0.00, File Size: 5.6 KB
Platform: Windows
WirelessNetView is a small utility that runs in the background, and monitor the Activity of wireless Networks around you. For each detected network, it displays the following information: SSID, Last Signal Quality, Average Signal Quality, Detection Counter, Authentication Algorithm, Cipher Algorithm, and more.
Category: Internet / Monitoring
Publisher: NirSoft Freeware, License: Freeware, Price: USD $0.00, File Size: 36.0 KB
Platform: Windows
WIFI Locator is a utility that runs in the background, and monitor the Activity of wireless Networks around you. For each detected network it displays the following information: SSID, Last Signal Quality, Average Signal Quality, Detection Counter MAC Address, RSSI, Channel Frequency, Channel Number, and more.
Category: Internet / Monitoring
Publisher: Francesco Bucci, License: Freeware, Price: USD $0.00, File Size: 452.2 KB
Platform: Windows
With a single click you can create flag Charts or Bar Charts from pre-defined themes to build a wide variety of timelines for printing, sharing or presentation. Timeline Maker Professional can open Timeline Maker Student files. You can show more data on the timeline chart by double clicking on an event.
Category: Utilities / Misc. Utilities
Publisher: Progeny Software, License: Shareware, Price: USD $97.50, File Size: 0
Platform: Windows
FusionCharts Free is a flash charting component that can be used to render data-driven & animated Charts for your web applications and presentations. It is a cross-browser and cross-platform solution that can be used with ASP.NET, ASP, PHP, JSP, ColdFusion, Ruby on Rails, simple HTML pages or even PowerPoint Presentations to deliver interactive and powerful flash Charts. You...
Category: Software Development
Publisher: InfoSoft Global (P) Ltd., License: Freeware, Price: USD $0.00, File Size: 2.7 MB
Platform: Windows, Mac, Linux,
This ASP.NET component draws pie and Bar Charts and line graphs "on the fly". Output can be streamed to the browser in GIF or other formats, saved to file or exported to a Bitmap structure. A wide range of properties allow the customisation of colour, size and text style. Built in defaults allow the production of graphs with only a few lines of code. Show percentages or actual...
Category: Software Development
Publisher: Chestysoft, License: Demo, Price: USD $60.00, File Size: 579.5 KB
Platform: Windows
Easy to creates dynamic Charts in the Macromedia Flash SWF format. Jobdao Flash Chart can transforms your data Charts into enjoyable and captivating communication. Data Charts don't have to be plain and austere, they can be interactive experiences with attractive visuals and animation.We offer a number of other advanced features: Jobdao Flash Chart is very easy...
Category: Multimedia & Design
Publisher: JobdaoNet, License: Shareware, Price: USD $39.00, File Size: 144.7 KB
Platform: Windows

