Free Downloads: Bar Graph
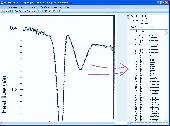
Graph Component provides 2D plotting facilities, it accepts any number of curves and provides user with ability to zoom, resize and print.
Graph Component works in two modes:
Offline Mode: In this mode the whole drawing points must be provided, the components render this points after calculating the appropriate scale. This mode supports linear and log...
Category: Business & Finance / Applications
Publisher: MathTools, License: Shareware, Price: USD $49.00, File Size: 1.9 MB
Platform: Windows
Graph-A-Ping allows you to visually see the ping latency between ping times.
Graph-A-Ping allows you to visually see the ping latency between ping times. The bigger the gap between one ping to another allows you to spot possible network bottle neck.
This tool is actually an applet part of Glass Net Networks monitoring console.
Category: Internet / Misc. Plugins
Publisher: Mataluis.Com, License: Freeware, Price: USD $0.00, File Size: 2.1 MB
Platform: Windows
Graph FAWM is a function graphing tool that is easy for teachers and students to use.
Graph FAWM is a function graphing tool that is easy for teachers and students to use. A wealth of information is available about any Graph just by moving the mouse pointer to a point of interest.
Main Features:
- True algebraic equation format
- Implicit equations
- Locates intercepts, turning points and points of...
Category: Business & Finance / Applications
Publisher: New FAWM Creations, License: Shareware, Price: USD $20.00, File Size: 4.6 MB
Platform: Windows
XYZ Data Viewer is a Excel table to 3-D graph converter.
XYZ Data Viewer is a Excel table to 3-D Graph converter. It provide easy way to analyze a variety of tabular data from Microsoft Excel in the view of 3-dimensions Graph. With this tool You can view and examine your data as a three-dimensional object in three-dimensional space, by manipulate the 3d object on the program screen. You can save this 3d Graph...
Category: Multimedia & Design / Media Management
Publisher: 3 Fish Software, License: Shareware, Price: USD $69.95, File Size: 9.1 MB
Platform: Windows
dcsDigitiser, a Graph digitizer and densitometer, converts graphs into digital X-Y numerical numbers for peer analysis of graphs and gel in the open literature and/or of your own hard copies. With excellent performance, dcsDigitiser is accurate, precise, versatile and straightforward in its use. It is now only a few clicks to get a numerical reading of graphs of interest while...
Category: Home & Education / Mathematics
Publisher: J & C Consultation and Technology, License: Shareware, Price: USD $120.00, File Size: 3.8 MB
Platform: Windows
aiSee reads a textual, easy-to-read and easy-to-learn Graph specification and automatically calculates a customizable Graph layout. This layout is then displayed, and can be interactively explored, printed and exported to various graphic formats.
See has been optimized to handle huge graphs automatically generated by applications. It is available for Windows,...
Category: Home & Education / Miscellaneous
Publisher: Ai-See, License: Shareware, Price: USD $395.00, File Size: 18.2 MB
Platform: Windows
Insight Graphing allows you to add graphs to your Clarion Windows, or Reports.
Insight Graphing allows you to add graphs to your Clarion Windows, or Reports. But more importantly than just the ability, it also provides a powerful template interface which allows you to Graph data directly out of your files, queues or memory. It also features complete control over the look of your Graph, from the axis settings, to the Graph itself,...
Category: Multimedia & Design / Multimedia App's
Publisher: Capesoft, License: Shareware, Price: USD $349.00, File Size: 968.0 KB
Platform: Windows
Graph Extract is a program for digitizing plots.
Graph Extract is a program for digitizing plots. Using either manual or automated approaches, this program provides a means to easily extract numeric data from plots. The resulting X-Y data can be printed or replotted, or it can be saved in Excel file for
Category: Multimedia & Design
Publisher: quadtechassociates.com, License: Freeware, Price: USD $0.00, File Size: 446.0 KB
Platform: Windows
CoGui is a free Graph-based visual tool, developed in Java, for building Conceptual Graph knowledge bases represented in COGXML format, compatible with Cogitant.
Features:
- Intuitive visual structures for building real-world knowledge bases
- Reasoning capabilities with Cogitant
- XML persistent storage
...
Category: Multimedia & Design / Video
Publisher: LIRMM, License: Shareware, Price: USD $0.00, File Size: 0
Platform: Windows
Graph visualization is a way of representing structural information as diagrams of abstract graphs and networks. Automatic Graph drawing has many important applications in software engineering, database and web design, networking, and in visual interfaces
Category: Multimedia & Design
Publisher: graphviz.org, License: Freeware, Price: USD $0.00, File Size: 26.6 MB
Platform: Windows, Mac, Vista
-- VFWH Monitor has the ability to calculate and Graph all the network traffic between local machine and any other machines. -- Main features of VFWH Monitor:Calculate statistics for bound Interfaces.Calculate statistics for chosen Connections.Calculate using time for Interfaces and Connections.Graph real-time diagram for Interfaces traffic....and more, more, more....
Category: Utilities / System Utilities
Publisher: Cyber Complete Systems, License: Shareware, Price: USD $35.00, File Size: 634.9 KB
Platform: Windows
Bytescout Graph Digitizer Scout is a handy and useful application that provides users with several functions. This program allows you to convert hard copy graphs, plots and charts. This efficient software enables you to digitize graphs, charts and plots using automated methods such as luminosity recognition and color recognition. The program works almost automatically, but you can...
Category: Multimedia & Design / Multimedia App's
Publisher: ByteScout, License: Shareware, Price: USD $34.45, File Size: 5.2 MB
Platform: Windows
Fly-through 3D graph software for exciting presentations, marketing, sales, analysis and fun!
Fly-through 3D Graph software for exciting presentations, marketing, sales, analysis and fun! Capture the attention of your audience with spectacular 3D technology. Instead of showing your audience another boring line Graph, capture their interest with something wildly different. They will be more likely to talk about and remember your presentation that had something...
Category: Business & Finance
Publisher: Swan Studios, License: Shareware, Price: USD $39.95, File Size: 8.5 MB
Platform: Windows
The NetGraph – network monitor 2.
The NetGraph – network monitor 2.0 is a software network-monitoring program that enables users to see at a glance the activities on their networks including the volumes of traffic with four simple Graph mode indicators.
The program works on any Windows’ network connection and NetGraph – network monitor 2.0’s four modes include 2 snapshot modes...
Category: Internet / Monitoring
Publisher: Nikola Dachev, License: Freeware, Price: USD $0.00, File Size: 0
Platform: Windows
Graphe Easy is a feature-rich yet easy-to-use 2d-graph plotting Windows software.
Graphe Easy is a feature-rich yet easy-to-use 2d-Graph plotting Windows software. It allows to draw many Graph types (cartesian, polar, parametric coordinates) and many other graphs such as conics, integrals, inequations or sequences. It also provides a wide range of tools to comment on the graphics and get high quality results.
Category: Utilities / System Utilities
Publisher: Olivier ANSQUER, License: Shareware, Price: USD $39.00, File Size: 4.2 MB
Platform: Windows
To succeed in mathematics, one must be able to solve the problems.
To succeed in mathematics, one must be able to solve the problems. MathXpert can help you learn to solve the problems in your mathematics course.
MathXpert was designed to replace blackboards and homework, not teachers and books.
When you press the Graph button, you immediately get a Graph of the expression or equation in the current calculation....
Category: Home & Education / Mathematics
Publisher: Michael Beeson, License: Shareware, Price: USD $89.95, File Size: 15.5 MB
Platform: Windows
SBHistogram generates simple histograms from simple ASCII data files.
SBHistogram generates simple histograms from simple ASCII data files. It's a simple tool designed to be easy to use.
A histogram is a chart in which data values in counted and placed into buckets. For example, let's assume you want to do a histogram of peoples ages. Then you might want to use buckets such as 1-10 years, 11-20 years, 21-30 years, etc. Each bucket counts the...
Category: Multimedia & Design / Multimedia App's
Publisher: SB-Software, License: Freeware, Price: USD $0.00, File Size: 604.0 KB
Platform: Windows
MathTrax is a graphing tool for middle school and high school students to Graph equations, physics simulations or plot data files.
The graphs have descriptions and sound so you can hear and read about the Graph. Blind and low vision users can access visual math data and Graph or experiment with equations and datasets.
Category: Business & Finance / Applications
Publisher: The MathTrax Team, License: Freeware, Price: USD $0.00, File Size: 21.0 MB
Platform: Windows
Visual Complex is a graph software to create graphs of complex variable functions.
Visual Complex is a Graph software to create graphs of complex variable functions.
Features:
-Creating 3D graphs of complex functions
-Creating color maps of complex functions
-Ability to edit Graph interactively
-Ability to copy and save Graph as bitmap.
Category: Multimedia & Design / Multimedia App's
Publisher: GraphNow Software, License: Shareware, Price: USD $25.00, File Size: 2.0 MB
Platform: Windows
 Shareware
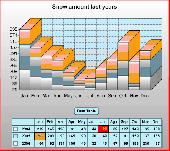
Super 2d/3d Graph Library is a customizable and powerful, yet light, .NET libray for drawing eye-candy charts and/or export them into PDF format, vector (Scalable Vector Graphics or SVG) and raster graphics file formats such as JPG, GIF, PNG, BMP, ... Same component may be used in WinForms or ASP.NET applications. Powerful features such as high resolution render, additional...
Category: Software Development / Components & Libraries
Publisher: Software Siglo XXI, License: Shareware, Price: USD $129.00, EUR99, File Size: 1.2 MB
Platform: Windows
The DOP software can visualize the input from your scale and show it as a graph.
The DOP software can visualize the input from your scale and show it as a Graph. All input data from the device are stored in the DOP and therefore it is possible to zoom in and out, store the data on disk and to analyze the data more carefully.
You can also print the Graph or save it as JPG and use it for documentation.
Category: Multimedia & Design / Multimedia App's
Publisher: Hauch & Bach ApS., License: Shareware, Price: USD $0.00, File Size: 457.4 KB
Platform: Windows
RJS Graph produces professional scientific and mathematical graphs.
RJS Graph produces professional scientific and mathematical graphs. You may study the data with a wide range of data analysis tools. Features include the ability to plot data and equations, fit best fit curves and splines, and display fitted best fit curve parameters. Data can be pasted from a spreadsheet or imported from a text file using a wizard.
Category: Home & Education / Mathematics
Publisher: RJS, License: Freeware, Price: USD $0.00, File Size: 3.7 MB
Platform: Windows
T&D Graph has been designed as a user friendly software which brings users even more effective tools for the management and analysis of data recorded by T&D Data Loggers. It contains a variety of useful functions including the ability to read and merge multiple data files and display recorded data in Graph and/or list form.
Category: Software Development / Misc. Programming
Publisher: T&D CORPORATION, License: Freeware, Price: USD $0.00, File Size: 11.3 MB
Platform: Windows
Function Analyzer is a program that draws the Graph of a function with one variable declared by the user. The operators used to build the mathematical expression are the usual ones used in software calculators: * for multiplying, / for dividing, ^ for power and so on. Parentheses can be used to group terms in your expression. Trigonometric functions are also supported, along with...
Category: Home & Education / Mathematics
Publisher: Lorenzi Davide, License: Freeware, Price: USD $0.00, File Size: 1.3 MB
Platform: Windows
Demo
Imagine a complete Graphing solution assisting you right from importing data and manipulating data, plotting graphs, customizing looks, saving and exporting your graphs as high quality images and producing dynamic reports of your data in a matter of a few easy steps. Features: Data Import: Connects effortlessly with your MS SQL Server, Oracle, Access, XLS and CSV files and additionally...
Category: Software Development / Databases & Networks
Publisher: Teknowledge LLC, License: Demo, Price: USD $99.00, File Size: 8.1 MB
Platform: Windows