Free Downloads: Bar Graph Indicators

This PHP script provides a very easy way to embed dynamically generated stacked horizontal Bar graphs and charts into PHP applications and HTML web pages. The graphing software is very easy to use and it's perfectly possible to add professional quality real time graphing to web pages and applications within minutes. With a free trial and Money Back Guarantee, try it out today.
Category: Audio
Publisher: Sirius Computer Consultants Limited, License: Shareware, Price: USD $49.00, File Size: 122.6 KB
Platform: Windows, Mac, Linux, OS/2, Unix
 Shareware
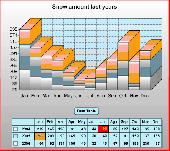
Super 2d/3d Graph Library is a customizable and powerful, yet light, .NET libray for drawing eye-candy charts and/or export them into PDF format, vector (Scalable Vector Graphics or SVG) and raster graphics file formats such as JPG, GIF, PNG, BMP, ... Same component may be used in WinForms or ASP.NET applications. Powerful features such as high resolution render, additional calculations,...
Category: Software Development / Components & Libraries
Publisher: Software Siglo XXI, License: Shareware, Price: USD $129.00, EUR99, File Size: 1.2 MB
Platform: Windows
Graph Component provides 2D plotting facilities, it accepts any number of curves and provides user with ability to zoom, resize and print.
Graph Component works in two modes:
Offline Mode: In this mode the whole drawing points must be provided, the components render this points after calculating the appropriate scale. This mode supports linear and log scale, also it...
Category: Business & Finance / Applications
Publisher: MathTools, License: Shareware, Price: USD $49.00, File Size: 1.9 MB
Platform: Windows
Shows wordplay types you can use to clue an answer in a cryptic crossword: anagrams; reversal; charades; container and contents; head, middle, tail and ends deletion; alternation; substitution. Links to extensive lists of Indicators with guidance on usage: abbreviation Indicators, anagram Indicators, charade Indicators, container and contents Indicators,...
Category: Games
Publisher: Crossword Man, License: Demo, Price: USD $29.00, File Size: 885.3 KB
Platform: Windows
Insight Graphing allows you to add graphs to your Clarion Windows, or Reports.
Insight Graphing allows you to add graphs to your Clarion Windows, or Reports. But more importantly than just the ability, it also provides a powerful template interface which allows you to Graph data directly out of your files, queues or memory. It also features complete control over the look of your Graph, from the axis settings, to the Graph itself, even the legend. You...
Category: Multimedia & Design / Multimedia App's
Publisher: Capesoft, License: Shareware, Price: USD $349.00, File Size: 968.0 KB
Platform: Windows
Grapher is the ultimate technical graphing package available.
Grapher is the ultimate technical graphing package available.
Choose from several specialty Graph types, including ternary, box-whisker, bubble plots, pie charts, and hi-low-close plots.
Wow your audience every time they see your graphs. Create one of 54 unique Graph types.
This easy-to-use, powerful, dynamic program will help you create...
Category: Multimedia & Design / Multimedia App's
Publisher: Golden Software, License: Shareware, Price: USD $0.00, File Size: 34.0 MB
Platform: Windows
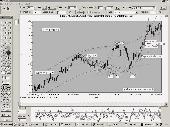
Fibonacci Trader is a true multiple time frame analysis software package for professional traders.
Fibonacci Trader is a true multiple time frame analysis software package for professional traders. All charts have the capacity to plot Indicators on three different time frames, which enables traders see what weekly and daily Indicators are displaying compared to their intraday Indicators on the same chart, all real-time. Fibonacci Trader works on all markets, stocks or...
Category: Business & Finance / Business Finance
Publisher: Fibonacci Trader Corp., License: Shareware, Price: USD $55.00, File Size: 13.2 MB
Platform: Windows
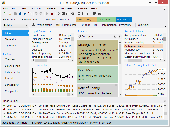
DealBook 360 has more than enough features, charting tools, indicators and news to help you trade.
DealBook 360 has more than enough features, charting tools, Indicators and news to help you trade.
Identify trends with over 85 technical Indicators, eight chart types and a wide range of timeframes.
Organize your trading space with custom layouts, so the platform is familiar each time you log in.
Category: Business & Finance / Business Finance
Publisher: Global Forex Trading, License: Freeware, Price: USD $0.00, File Size: 25.9 MB
Platform: Windows
Graph constructs, visualizes and modifies graphs as well as calculates measures and layouts.
Graph constructs, visualizes and modifies graphs as well as calculates measures and layouts.
CoSBiLab Graph can construct, visualize and modify graphs as well as calculate measures and layouts. CoSBiLab Graph can import and export data in a variety of formats, among which the reaction network generated by the beta WorkBench.
Category: Multimedia & Design / Multimedia App's
Publisher: CoSBi, License: Freeware, Price: USD $0.00, File Size: 3.1 MB
Platform: Windows
DataPlot is a program where you can import your time based data and graph it.
DataPlot is a program where you can import your time based data and Graph it.You can move easily back and forward in user defined time window, allows individual time setting for each Graph, values read directly in Graph by dragging mouse over the curve and much more
Category: Multimedia & Design / Multimedia App's
Publisher: CBIM, License: Freeware, Price: USD $0.00, File Size: 311.0 KB
Platform: Windows
The BSC Designer Light provides basic functionality for KPI management.
The BSC Designer Light provides basic functionality for KPI management. This software is a great alternative to the manual design of scorecards. Any time the Light version can be upgraded to Standard or Professional.
BSC Designer Light provides functions necessary to create and manage Indicators, calculate Indicators’ performance using their values and relative...
Category: Business & Finance / Business Finance
Publisher: AKS-Labs, License: Freeware, Price: USD $0.00, File Size: 13.7 MB
Platform: Windows
Drawing graphs without the right tool is simply difficult.
Drawing graphs without the right tool is simply difficult. uDraw(Graph) automates this task for you. Find out how uDraw(Graph) creates your flow charts, diagrams, hierarchies or structure visualizations using automatic layout - much faster than with any standard drawing program. With the API, uDraw(Graph) can even be embedded in your own programs as a visualization component.
Category: Multimedia & Design / Image Editing
Publisher: University Bremen, FB3, Germany, License: Freeware, Price: USD $0.00, File Size: 2.6 MB
Platform: Windows
Demo
This COM object / ASP component draws pie and Bar charts and line graphs on the fly. Output can be streamed to the browser using BinaryWrite, or saved to file. Image types include GIF, PNG, JPG and bitmap. A wide range of properties allow the customisation of colour, size and text style. Built in defaults allow the production of graphs with only a few lines of code. Show percentages or...
Category: Web Authoring / Scripts & CGI Tools
Publisher: Chestysoft, License: Demo, Price: USD $60.00, File Size: 594.9 KB
Platform: Windows
Make Professional Website Voting Polls Quickly and Easily.
Make Professional Website Voting Polls Quickly and Easily. Preview while you work. WYSIWYG design. Several customizable features including background images, background colors, border, fonts, size, and more. Unlimited Bar Graph colors. Show or hide Bar Graph and number of votes. View voting results instantly online. Prevent duplicate votes by checking IP addresses....
Category: Web Authoring / Web Design Utilities
Publisher: Oven Fresh Web Design, License: Shareware, Price: USD $27.95, File Size: 5.3 MB
Platform: Windows
This ASP.NET component draws pie and Bar charts and line graphs "on the fly". Output can be streamed to the browser in GIF or other formats, saved to file or exported to a Bitmap structure. A wide range of properties allow the customisation of colour, size and text style. Built in defaults allow the production of graphs with only a few lines of code. Show percentages or actual values....
Category: Software Development
Publisher: Chestysoft, License: Demo, Price: USD $60.00, File Size: 579.5 KB
Platform: Windows
-- VFWH Monitor has the ability to calculate and Graph all the network traffic between local machine and any other machines. -- Main features of VFWH Monitor:Calculate statistics for bound Interfaces.Calculate statistics for chosen Connections.Calculate using time for Interfaces and Connections.Graph real-time diagram for Interfaces traffic....and more, more, more. Just explore...
Category: Utilities / System Utilities
Publisher: Cyber Complete Systems, License: Shareware, Price: USD $35.00, File Size: 634.9 KB
Platform: Windows
Freeware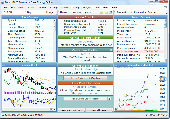
Forex Strategy Builder is a complete solution for building and testing CFD, Indexes and Forex trading strategies. It is free to use and distribute. Forex Strategy Builder's user friendly interface allows you to create and back test a profitable trading system with just a few clicks. Thanks to the program's automatic system generator you can successfully build a market strategy without having...
Category: Business & Finance / Auction Tools
Publisher: Forex Software, License: Freeware, Price: USD $0.00, File Size: 5.2 MB
Platform: Windows
Forex Strategy Builder Professional is a complete solution for building and testing CFD, Indexes and Forex trading strategies. It is free to use and distribute. Forex Strategy Builder's user friendly interface allows you to create and back test a profitable trading system with just a few clicks. Thanks to the program's automatic system generator you can successfully build a market strategy...
Category: Business & Finance / Auction Tools
Publisher: Forex Software Ltd, License: Shareware, Price: USD $248.00, EUR248, File Size: 9.6 MB
Platform: Windows
ImageApp is a program that involves a lot of principles from machine vision.
ImageApp is a program that involves a lot of principles from machine vision. A GUI that allows you to build up an image processing Graph. An image processing Graph is essentially a sequence of algorithms that do something to images. You can imagine the Graph as the algorithms being the nodes and the flow-of-->data between the algorithms being the arcs.
For...
Category: Multimedia & Design / Multimedia App's
Publisher: Laurence Smith, License: Shareware, Price: USD $0.00, File Size: 0
Platform: Windows
OPC Scada Viewer allows you to easily and very visually display data received via the OPC interface.
OPC Scada Viewer allows you to easily and very visually display data received via the OPC interface. Data is displayed in real time, which allows you to use the program for permanent control and monitoring in various systems. OPC Scada Viewer offers a lot of Indicators for displaying the values of OPC tags, from simple analog pointer Indicators to charts and diagrams. It is...
Category: Utilities / System Utilities
Publisher: AGG Software, License: Shareware, Price: USD $39.00, File Size: 5.6 MB
Platform: Windows
The WebViewer plug-in enables Windows users whether or not they have SigmaPlot to explore the data used to create the Graph.
Using the WebViewer plug-in with your Web browser window you can:
- View the data used to create the Graph
- Print a Graph in a web document at full resolution
- Zoom in and out of a Graph
- Grab and...
Category: Multimedia & Design / Graphics Viewers
Publisher: SYSTAT Software Inc., License: Freeware, Price: USD $0.00, File Size: 12.6 MB
Platform: Windows
Tools soft collection contains menu applets with fade effect, slide menus, tree menus,and dropdown menus, and also charting and Graph applets (pie and Bar styles).Presentation applets like head scroll, newsticker, and fade ticker applets.
Category: Web Authoring / Reference & Tutorials
Publisher: Tools Soft Solutions, License: Shareware, Price: USD $9.00, File Size: 55.0 KB
Platform: Windows, Linux,
Make Website Voting Polls Quickly and Easily.
Make Website Voting Polls Quickly and Easily. Preview while you work. WYSIWYG design. Lots of customizable features including background images, background colors, header images, border, button, cursor, fonts, size, and more. Unlimited Bar Graph colors. Show or hide Bar Graph. Show or hide number of votes. View voting results instantly online. Prevent duplicate votes...
Category: Web Authoring / Web Design Utilities
Publisher: Oven Fresh Web Design, License: Shareware, Price: USD $27.95, File Size: 5.3 MB
Platform: Windows
With The Option Strategy Builder you could pick up an option and place it directly to the return Graph. As with the online tool, just drag and drop the option on the Graph, and build your strategy. Using your mouse, the options can be easily moved on the Graph to different strike prices, and to different expiration dates.
With this program you can manage your...
Category: Multimedia & Design / Multimedia App's
Publisher: SamoaSky, License: Freeware, Price: USD $0.00, File Size: 3.1 MB
Platform: Windows
QChartist is a free charting software to do technical analysis on any data like Forex, Stocks. It helps to make market forecasts with the help of technical objects and Indicators. You can draw geometrical shapes on your charts or plot programmable Indicators from your data. It is also possible to filter or merge data. It has built-in astro Indicators and realtime quotes. It...
Category: Business & Finance / Business Finance
Publisher: Julien Moog, License: Freeware, Price: USD $0.00, File Size: 1.1 MB
Platform: Windows, Other