Free Downloads: Bar Graph Software
Excel Graph Multiple Equations Software is an application that allows you to plot multiple functions in Microsoft Excel. It is able to create multiple charts based on the formulas entered. You can enter an equation manually or load multiple equations from a text file (.txt). The application is able to plot each equation on an individual Graph or all the equations on a...
Category: Business & Finance / MS Office Addons
Publisher: Sobolsoft, License: Shareware, Price: USD $19.99, File Size: 2.5 MB
Platform: Windows
DataPlot is a program where you can import your time based data and graph it.
DataPlot is a program where you can import your time based data and Graph it.You can move easily back and forward in user defined time window, allows individual time setting for each Graph, values read directly in Graph by dragging mouse over the curve and much more
Category: Multimedia & Design / Multimedia App's
Publisher: CBIM, License: Freeware, Price: USD $0.00, File Size: 311.0 KB
Platform: Windows
Drawing graphs without the right tool is simply difficult.
Drawing graphs without the right tool is simply difficult. uDraw(Graph) automates this task for you. Find out how uDraw(Graph) creates your flow charts, diagrams, hierarchies or structure visualizations using automatic layout - much faster than with any standard drawing program. With the API, uDraw(Graph) can even be embedded in your own programs as a visualization component.
Category: Multimedia & Design / Image Editing
Publisher: University Bremen, FB3, Germany, License: Freeware, Price: USD $0.00, File Size: 2.6 MB
Platform: Windows


 Demo
DemoThis COM object / ASP component draws pie and Bar charts and line graphs on the fly. Output can be streamed to the browser using BinaryWrite, or saved to file. Image types include GIF, PNG, JPG and bitmap. A wide range of properties allow the customisation of colour, size and text style. Built in defaults allow the production of graphs with only a few lines of code. Show percentages or...
Category: Web Authoring / Scripts & CGI Tools
Publisher: Chestysoft, License: Demo, Price: USD $60.00, File Size: 594.9 KB
Platform: Windows
Make Professional Website Voting Polls Quickly and Easily.
Make Professional Website Voting Polls Quickly and Easily. Preview while you work. WYSIWYG design. Several customizable features including background images, background colors, border, fonts, size, and more. Unlimited Bar Graph colors. Show or hide Bar Graph and number of votes. View voting results instantly online. Prevent duplicate votes by checking IP addresses....
Category: Web Authoring / Web Design Utilities
Publisher: Oven Fresh Web Design, License: Shareware, Price: USD $27.95, File Size: 5.3 MB
Platform: Windows
This ASP.NET component draws pie and Bar charts and line graphs "on the fly". Output can be streamed to the browser in GIF or other formats, saved to file or exported to a Bitmap structure. A wide range of properties allow the customisation of colour, size and text style. Built in defaults allow the production of graphs with only a few lines of code. Show percentages or actual values....
Category: Software Development
Publisher: Chestysoft, License: Demo, Price: USD $60.00, File Size: 579.5 KB
Platform: Windows
-- VFWH Monitor has the ability to calculate and Graph all the network traffic between local machine and any other machines. -- Main features of VFWH Monitor:Calculate statistics for bound Interfaces.Calculate statistics for chosen Connections.Calculate using time for Interfaces and Connections.Graph real-time diagram for Interfaces traffic....and more, more, more. Just explore...
Category: Utilities / System Utilities
Publisher: Cyber Complete Systems, License: Shareware, Price: USD $35.00, File Size: 634.9 KB
Platform: Windows
ImageApp is a program that involves a lot of principles from machine vision.
ImageApp is a program that involves a lot of principles from machine vision. A GUI that allows you to build up an image processing Graph. An image processing Graph is essentially a sequence of algorithms that do something to images. You can imagine the Graph as the algorithms being the nodes and the flow-of-->data between the algorithms being the arcs.
For...
Category: Multimedia & Design / Multimedia App's
Publisher: Laurence Smith, License: Shareware, Price: USD $0.00, File Size: 0
Platform: Windows
Audio Graph ActiveX is an ActiveX (OCX) component for Software developers. With this ActiveX component you can display a meter, detect a silence, and display 2 types of audio graphs by the WaveIn/WaveOut buffers. Just send a pointer of the buffers array to the component then operate the Display function, the component will do the rest on the Graph view. You can set the...
Category: Software Development
Publisher: expresslib.com, License: Shareware, Price: USD $69.00, File Size: 806.5 KB
Platform: Windows
The WebViewer plug-in enables Windows users whether or not they have SigmaPlot to explore the data used to create the Graph.
Using the WebViewer plug-in with your Web browser window you can:
- View the data used to create the Graph
- Print a Graph in a web document at full resolution
- Zoom in and out of a Graph
- Grab and...
Category: Multimedia & Design / Graphics Viewers
Publisher: SYSTAT Software Inc., License: Freeware, Price: USD $0.00, File Size: 12.6 MB
Platform: Windows
Tools soft collection contains menu applets with fade effect, slide menus, tree menus,and dropdown menus, and also charting and Graph applets (pie and Bar styles).Presentation applets like head scroll, newsticker, and fade ticker applets.
Category: Web Authoring / Reference & Tutorials
Publisher: Tools Soft Solutions, License: Shareware, Price: USD $9.00, File Size: 55.0 KB
Platform: Windows, Linux,
Make Website Voting Polls Quickly and Easily.
Make Website Voting Polls Quickly and Easily. Preview while you work. WYSIWYG design. Lots of customizable features including background images, background colors, header images, border, button, cursor, fonts, size, and more. Unlimited Bar Graph colors. Show or hide Bar Graph. Show or hide number of votes. View voting results instantly online. Prevent duplicate votes...
Category: Web Authoring / Web Design Utilities
Publisher: Oven Fresh Web Design, License: Shareware, Price: USD $27.95, File Size: 5.3 MB
Platform: Windows
With The Option Strategy Builder you could pick up an option and place it directly to the return Graph. As with the online tool, just drag and drop the option on the Graph, and build your strategy. Using your mouse, the options can be easily moved on the Graph to different strike prices, and to different expiration dates.
With this program you can manage your...
Category: Multimedia & Design / Multimedia App's
Publisher: SamoaSky, License: Freeware, Price: USD $0.00, File Size: 3.1 MB
Platform: Windows
Graphe Easy is a feature-rich yet easy-to-use 2d-graph plotting Windows software.
Graphe Easy is a feature-rich yet easy-to-use 2d-Graph plotting Windows Software. It allows to draw many Graph types (cartesian, polar, parametric coordinates) and many other graphs such as conics, integrals, inequations or sequences. It also provides a wide range of tools to comment on the graphics and get high quality results.
Category: Utilities / System Utilities
Publisher: Olivier ANSQUER, License: Shareware, Price: USD $39.00, File Size: 4.2 MB
Platform: Windows


 Demo
DemoImagine a complete Graphing solution assisting you right from importing data and manipulating data, plotting graphs, customizing looks, saving and exporting your graphs as high quality images and producing dynamic reports of your data in a matter of a few easy steps. Features: Data Import: Connects effortlessly with your MS SQL Server, Oracle, Access, XLS and CSV files and additionally...
Category: Software Development / Databases & Networks
Publisher: Teknowledge LLC, License: Demo, Price: USD $99.00, File Size: 8.1 MB
Platform: Windows
Fly-through 3D graph software for exciting presentations, marketing, sales, analysis and fun!
Fly-through 3D Graph Software for exciting presentations, marketing, sales, analysis and fun! Capture the attention of your audience with spectacular 3D technology. Instead of showing your audience another boring line Graph, capture their interest with something wildly different. They will be more likely to talk about and remember your presentation that had something that...
Category: Business & Finance
Publisher: Swan Studios, License: Shareware, Price: USD $39.95, File Size: 8.5 MB
Platform: Windows
New Features of DataStudio:
- Video Player and Synchronization -- Play a movie or synch a movie to experimental data
- Presentation Style Graph -- Additional Graph style that moves measurements and units outside the Graph; ideal for publication of DataStudio graphs in educational journals
- Predictive Sketching -- Students can draw directly on the...
Category: Home & Education / Miscellaneous
Publisher: PASCO, License: Demo, Price: USD $0.00, File Size: 32.8 MB
Platform: Windows
Graph visualization is a way of representing structural information as diagrams of abstract graphs and networks. Automatic Graph drawing has many important applications in Software engineering, database and web design, networking, and in visual interfaces
Category: Multimedia & Design
Publisher: graphviz.org, License: Freeware, Price: USD $0.00, File Size: 26.6 MB
Platform: Windows, Mac, Vista
Visual Complex is a graph software to create graphs of complex variable functions.
Visual Complex is a Graph Software to create graphs of complex variable functions.
Features:
-Creating 3D graphs of complex functions
-Creating color maps of complex functions
-Ability to edit Graph interactively
-Ability to copy and save Graph as bitmap.
Category: Multimedia & Design / Multimedia App's
Publisher: GraphNow Software, License: Shareware, Price: USD $25.00, File Size: 2.0 MB
Platform: Windows
Bytescout Graph Digitizer Scout is a handy and useful application that provides users with several functions. This program allows you to convert hard copy graphs, plots and charts. This efficient Software enables you to digitize graphs, charts and plots using automated methods such as luminosity recognition and color recognition. The program works almost automatically, but you can...
Category: Multimedia & Design / Multimedia App's
Publisher: ByteScout, License: Shareware, Price: USD $34.45, File Size: 5.2 MB
Platform: Windows
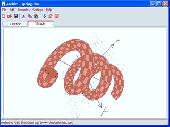
Archim is a program for drawing the graphs of all kinds of functions. You can define a Graph explicitly and parametrically, in polar and spherical coordinates, on a plane and in space (surface). Archim will be useful for teachers and students, as well as for everyone who is interested min geometry. With Archim, you will draw the Graph of any function and form, just use your...
Category: Home & Education
Publisher: Stochastic Lab, License: Freeware, Price: USD $0.00, File Size: 479.6 KB
Platform: Windows
The DOP software can visualize the input from your scale and show it as a graph.
The DOP Software can visualize the input from your scale and show it as a Graph. All input data from the device are stored in the DOP and therefore it is possible to zoom in and out, store the data on disk and to analyze the data more carefully.
You can also print the Graph or save it as JPG and use it for documentation.
Category: Multimedia & Design / Multimedia App's
Publisher: Hauch & Bach ApS., License: Shareware, Price: USD $0.00, File Size: 457.4 KB
Platform: Windows
Graph-A-Ping allows you to visually see the ping latency between ping times.
Graph-A-Ping allows you to visually see the ping latency between ping times. The bigger the gap between one ping to another allows you to spot possible network bottle neck.
This tool is actually an applet part of Glass Net Networks monitoring console.
Category: Internet / Misc. Plugins
Publisher: Mataluis.Com, License: Freeware, Price: USD $0.00, File Size: 2.1 MB
Platform: Windows
Graph FAWM is a function graphing tool that is easy for teachers and students to use.
Graph FAWM is a function graphing tool that is easy for teachers and students to use. A wealth of information is available about any Graph just by moving the mouse pointer to a point of interest.
Category: Business & Finance / Applications
Main Features:
- True algebraic equation format
- Implicit equations
- Locates intercepts, turning points and points of intersection
Publisher: New FAWM Creations, License: Shareware, Price: USD $20.00, File Size: 4.6 MB
Platform: Windows
XYZ Data Viewer is a Excel table to 3-D graph converter.
XYZ Data Viewer is a Excel table to 3-D Graph converter. It provide easy way to analyze a variety of tabular data from Microsoft Excel in the view of 3-dimensions Graph. With this tool You can view and examine your data as a three-dimensional object in three-dimensional space, by manipulate the 3d object on the program screen. You can save this 3d Graph as a file and upload...
Category: Multimedia & Design / Media Management
Publisher: 3 Fish Software, License: Shareware, Price: USD $69.95, File Size: 9.1 MB
Platform: Windows

