Free Downloads: Build Charts
Now you can easily create your own flow charts with Quickstart Flow Chart Maker Pro.
Now you can easily create your own flow Charts with Quickstart Flow Chart Maker Pro. Turn your ideas into clear and easy-to-understand flow Charts to communicate effectively. Quickly create customized flow Charts, diagrams, organizational Charts, and more. Simple drag-and-drop symbol shapes make it a snap to create professional-looking flow Charts. Organize...
Category: Multimedia & Design / Multimedia App's
Publisher: Selectsoft, License: Shareware, Price: USD $7.99, File Size: 0
Platform: Windows
Java Chart Designer is a powerful charting Java application that empowers you with all necessary tools to create Charts for professionally looking presentations, business and scientific reports that can be easily integrated into website as Java applet, Java applications or saved as JPEG images. A user-friendly interface, great number of visual effects and predefined chart types, flexible...
Category: Business & Finance
Publisher: ELTIMA Software GmbH, License: Shareware, Price: USD $99.95, File Size: 2.8 MB
Platform: Windows
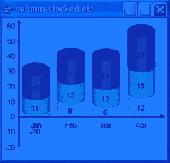
ADSS Charts Control designed to display three types of Charts: Horizontal bar Chart, Vertical bar Chart, Pie Chart, key Features: supports Captions and Values.Text can be aligned,control allows to display text information inside and outside chart elements. Chart data can be grouped in Groups. Can be updated in real-time for creating of animated Charts. Control provides high...
Category: Software Development / Components & Libraries
Publisher: Advanced Software Solutions, License: Shareware, Price: USD $47.00, File Size: 716.8 KB
Platform: Windows
JFreeChart Demo is a demo of another product, JFreeChart, that is a free Java chart library for program developers. By using JFreeChart, the Java developers will be able to include professional quality Charts in the applications they Build. JFreeChart Demo just demonstrates the Charts that are included in that .class file. You will be able to download it and see the...
Category: Software Development / Misc. Programming
Publisher: Object Refinery, License: Demo, Price: USD $65.00, File Size: 847 B
Platform: Windows
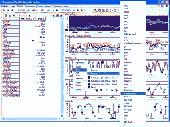
Traders demand tools which are powerful, reliable, fast and easy to use.
Traders demand tools which are powerful, reliable, fast and easy to use. Netquote delivers this with the introduction of Netquote Charts, the next generation in desktop charting applications.
Netquote Charts is a fully featured technical analysis charting application. Combining sophisticated market tools in a modern easy to use interface. Best of all Netquote...
Category: Business & Finance / MS Office Addons
Publisher: Netquote Information Services Pty Ltd, License: Freeware, Price: USD $0.00, File Size: 9.1 MB
Platform: Windows
RealtimeStockreader shows you the intraday charts of your stock symbols.
RealtimeStockreader shows you the intraday Charts of your stock symbols. These Charts are being updated every minute (the updating interval can be configured).
RealtimeStockreader alerts you (acoustically) when stocks have reached limits. You can specify lower (STOP LOSS) and upper limits.
Category: Business & Finance / Business Finance
Publisher: realtimestockreader, License: Freeware, Price: USD $0.00, File Size: 69.6 KB
Platform: Windows
Flow Charting is a dedicated program designed for the creation, editing, and printing of flow Charts, org Charts, data flow diagrams, and process control Charts.
Drawing programs are great for drawings - but not for flowcharts. If you are using a drawing program or some other program with "flowcharting tools" to create your flowcharts, try Flow...
Category: Multimedia & Design / Fonts
Publisher: Patton & Patton Software Corporation, License: Shareware, Price: USD $159.00, File Size: 11.0 MB
Platform: Windows
When you run Timing Solution Natal Charts Viewer, you see immediately that it is totally different from other programs for natal Charts . The most programs deal with PAST explanation of movement and HOPES that the FUTURE movement repeats the patterns revealed and explained for the past. Timing Solution provides totally different approach. It is totally concentrated on the forecast...
Category: Home & Education / Astrology & Numerology
Publisher: Timing Solution, License: Freeware, Price: USD $0.00, File Size: 1.2 MB
Platform: Windows
 Shareware
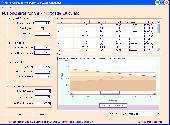
FusionCharts for VB is a charting component for Microsoft Visual Basic 6.0. It allows you to render interactive and animated Charts in your Visual Basic applications. With the ability to render over 40 chart types spanning both 2D and 3D Charts, it can render a pretty face to virtually any type of data that is otherwise boring. The best part is that you do not need to know...
Category: Software Development / Components & Libraries
Publisher: InfoSoft Global (P) Ltd., License: Shareware, Price: USD $99.00, File Size: 10.0 MB
Platform: Windows
The SSChart candlestick charting software runs under Windows and Charts financial data from a variety of sources. Realtime intraday charting of futures, stocks, options, indicies and forex with data from Interactive Brokers TWS. Graphical trading from the Charts in either simulated or real mode. Realistic paper trading using real-time data.
Features:
- Historical...
Category: Business & Finance / Business Finance
Publisher: Simian Savants LLC, License: Shareware, Price: USD $50.00, File Size: 4.3 MB
Platform: Windows
Set of Php Classes for creating charts and graphs.
Set of Php Classes for creating Charts and graphs. It supports more than 18 types (linechart, piechart, barchart, radarchart, curves , gauges, 3D Charts, Candlestick, areacharts) and combinations of them. It includes a richt set of features like labels, notes, tips, multiple axis, logarithmic axis, date axis, pattern fillings, transparencies, stacked axis, stacked Charts,...
Category: Web Authoring / Web Design Utilities
Publisher: J4L Components, License: Demo, Price: USD $40.00, File Size: 1.0 MB
Platform: Windows, Linux
The QI Macros SPC Software for Excel draws pareto Charts, control Charts, histograms, box and whisker plots, scatter plots and more. There are four "wizards" that figure out what chart or statistic to draw based on your data. Better yet we do it right in Excel. Your just select your data and then select the chart from the QI Macros menu. It also includes over 90 fill in...
Category: Business & Finance / MS Office Addons
Publisher: KnowWare International, Inc., License: Shareware, Price: USD $199.00, File Size: 12.7 MB
Platform: Windows
Bull's-Eye Broker is an advanced software package which constructs and maintains Point & Figure Charts. The software is Windows based and runs under Windows 2000, Window 98, Windows 95 or Windows NT. Bull's-Eye Broker is the only software package for the serious point and figure chartist and is the ideal companion for other technical charting software. The software has the following...
Category: Business & Finance / Applications
Publisher: Archer Analysis, License: Shareware, Price: USD $49.95, File Size: 6.4 MB
Platform: Windows
OCENS MetMapper transforms weather maps, satellite images, and ocean Charts, into dynamic components of your at-sea decision-making tool box. MetMapper offers to all non-GRIB data what our GRIB Explorer software does for the GRIB data. That is, it will take classical weather data such as weather Charts, ocean Charts and satellite imagery and render them into interactive...
Category: Home & Education / Miscellaneous
Publisher: OCENS, Inc., License: Shareware, Price: USD $169.00, File Size: 23.6 MB
Platform: Windows
DecisionEdge provides the Charts managers need to understand and share key information about their projects. By clicking a toolbar button in Microsoft Office Project, managers can quickly access over 100 new Charts and reports that help them plan resource allocation, keep stakeholders informed, combine and compare projects, track project status, and measure project performance...
Category: Business & Finance / Project Management
Publisher: DecisionEdge, Inc., License: Commercial, Price: USD $299.00, File Size: 41.7 MB
Platform: Windows
Plan, track and analyze your investments with Investment Studio (TM)! Build custom screens in seconds. Program grids, Charts and trading systems with simple, spreadsheet-style expressions and almost 400 powerful built-in functions. Create custom indicators and functions using your favorite ActiveX Scripting language. Download and parse quotes on any format, anywhere. Freely mix...
Category: Business & Finance
Publisher: InvestmentStudio.com, License: Shareware, Price: USD $9.95, File Size: 4.3 MB
Platform: Windows
Rich Chart Builder transforms your data Charts into enjoyable and captivating communication. Data Charts don't have to be plain and austere, they can be interactive experiences with attractive visuals, animation and even voice explanations describing the important facts behind the numbers. Features and Benefits: - Impressive Charts: Create stunning Rich Media...
Category: Multimedia & Design
Publisher: Blue Pacific Software, License: Shareware, Price: USD $225.00, File Size: 4.6 MB
Platform: Windows
EasyGrapher Professional 2004 is needlework software for designers who want to create more complex cross stitch Charts and also Charts for needlepoint, Hardanger, Bargello, and other needlework. It has all the features that EasyGrapher Home and EasyGrapher Specialty have, plus a lot more.
There are many features that are useful for customizing Charts to give them a...
Category: Multimedia & Design / Media Catalogers
Publisher: Davis Computer Services, Inc., License: Shareware, Price: USD $299.00, File Size: 8.5 MB
Platform: Windows
MindFusion.Charting.WebForms provides applications targeting the .NET platform the ability to create and display various kinds of Charts. The component supports bar, pie, doughnut, scatter, bubble, line, area, radar and polar Charts. Many features of MindFusion.Charting.WebForms output can be customized in a way that suits your project best. Charts can have different...
Category: Software Development / Misc. Programming
Publisher: MindFusion, License: Demo, Price: USD $0.00, File Size: 5.0 MB
Platform: Windows
Free Stock Charting Software with historical charts, technical analysis indicators and news.
Free Stock Charting Software with historical Charts, technical analysis indicators and news. We have taken the open source eclipse trade and cleaned up a version specific to news and Charts with technical analysis.
Category: Business & Finance / Business Finance
Publisher: pennystocknet.com, License: Freeware, Price: USD $0.00, File Size: 26.7 MB
Platform: Windows, Vista
Quantum Charts™ empowers you to easily create and back test trading strategies in minutes with breakthrough technology that analyzes the market for you. Open a chart, click on a bar, and Quantum Charts provides you with a comprehensive list of true conditions for that bar.
Select any set of conditions you want to back test and drag them into the patent pending...
Category: Business & Finance / Business Finance
Publisher: Quantum Trading Technologies, License: Freeware, Price: USD $0.00, File Size: 454.9 KB
Platform: Windows
The Exontrol's ExGantt component is the approach to create timeline Charts (also known as Gantt Charts). Gantt chart is a time-phased graphic display of activity durations. Activities are listed with other tabular information on the left side with time intervals over the bars. Activity durations are shown in the form of horizontal bars. The exGantt component lets the user...
Category: Utilities / Misc. Utilities
Publisher: Exontrol, License: Freeware, Price: USD $0.00, File Size: 18.0 MB
Platform: Windows
Build hundreds of combines of Charts, Diagrams, AutoShapes, Drawings, WordArts, Reports, Tables, Cards, Labels, Forms and Sheets in Microsoft Excel just a minute. You could input complicated formulas into Diagram, AutoShape, WordArt, Drawing and other objects easily. Immediately, you become a Excel expert and programmer! Don't need any special skill, experience and technology....
Category: Business & Finance / Spreadsheets
Publisher: Addintools, License: Shareware, Price: USD $29.95, File Size: 2.9 MB
Platform: Unknown
Add Powerful reporting features to your Web / Intranet pages and applications. With advanced graphing you will be quickly adding impressive and dynamic charting capabilities bringing your data alive ! The PHP graphing scripts provide a very easy way to embed dynamically generated graphs and Charts into PHP applications and HTML web pages.Very easy to use and add professional quality...
Category: Software Development
Publisher: Sirius Computer Consultants Limited, License: Shareware, Price: USD $345.00, File Size: 1.5 MB
Platform: Windows, Mac, Linux, OS/2, Unix
FCharts SE is a free stock charting program which will import price data from a wide range of sources, displaying it as OHLC, Candlestick and Line Charts. It has a number of built-in indicators (MACD, RSI, Exponential and Standard Moving Averages), or you can write your own with the inbuilt formula language and display them as standalone Charts or overlays. You can draw trend...
Category: Business & Finance / Business Finance
Publisher: Spacejock Software, License: Freeware, Price: USD $0.00, File Size: 3.1 MB
Platform: Windows