Free Downloads: Business Charts
Data Envelopment Analysis (DEA) is a powerful method widely used in the evaluation of performance of Decision Making Units (DMUs). These can be Business units (for example points of sales, bank branches, dealers, franchisees), government agencies, police departments, hospitals, educational institutions, and even people (DEA has been used in the assessment of athletic, sales and student...
Category: Business & Finance
Publisher: Productivity Tools, License: Shareware, Price: USD $180.00, File Size: 1.7 MB
Platform: Windows
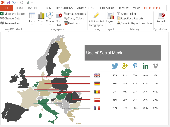
OfficeReports Link links data from Excel ranges to native PowerPoint tables, Charts and shapes. This can be done in such a way, so backgroundcolors from Excel cells are shown as logos and icons in PowerPoint. The Excel ranges can have a variable number of rows and/or columns, and OfficeReports is integrated with Excels and PowerPoints Macro engine. Microsoft Office already contains...
Category: Business & Finance / Business Finance
Publisher: OfficeReports, License: Shareware, Price: USD $39.00, File Size: 609.0 KB
Platform: Windows
RFFlow is the ideal program for creating a wide variety of flowcharts, organization Charts, and diagrams for education, Business, and industry. It's easy to draw and edit Charts with RFFlow. Simply drag a shape from a stencil to your chart. Shapes in RFFlow will automatically size around your text. Right-click on a shape or line to edit its properties. RFFlow includes...
Category: Business & Finance
Publisher: RFF Electronics, License: Shareware, Price: USD $49.00, File Size: 4.1 MB
Platform: Windows
EasyCharts is a complete library of java chart components, chart applets, and chart servlets that enable programmers to add Charts and graphs in java applications, web applications, and web pages with just a few lines of code. The java chart library includes bar Charts, line Charts, and pie Charts and is highly configurable. The java chart library supports...
Category: Software Development
Publisher: ObjectPlanet, Inc., License: Demo, Price: USD $450.00, File Size: 2.8 MB
Platform: Windows, Mac, Linux, Unix, Java
A photoshop plugin which allows you to read NOAA marine Charts.NOAA marine Charts are the standard raster Charts and have the file extension of *.bsb and *.kap.Once a chart is imported into Photoshop you can:- Print the chart.- Paste Charts together to cover a larger area.- Create and print your own custom Charts to cover the area you want.- Edit...
Category: Multimedia & Design / Image Editing
Publisher: Apocgraphy, License: Shareware, Price: USD $20.00, File Size: 20.5 KB
Platform: Unknown
Now you can easily create your own flow charts with Quickstart Flow Chart Maker Pro.
Now you can easily create your own flow Charts with Quickstart Flow Chart Maker Pro. Turn your ideas into clear and easy-to-understand flow Charts to communicate effectively. Quickly create customized flow Charts, diagrams, organizational Charts, and more. Simple drag-and-drop symbol shapes make it a snap to create professional-looking flow Charts. Organize...
Category: Multimedia & Design / Multimedia App's
Publisher: Selectsoft, License: Shareware, Price: USD $7.99, File Size: 0
Platform: Windows
An all-inclusive diagramming software for OS X that is capable for 260+ drawing types including flowcharts, mind maps, org Charts, infographics, floor plans, AWS network diagrams, Gantt Charts, electrical schematics... and that is just the beginning! More than 260 kinds of diagrams help you analyze data easily and present information nicely. Make complex statistics understandable...
Category: Multimedia & Design / Digital Media Editors
Publisher: EdrawSoft, License: Shareware, Price: USD $99.00, File Size: 229.1 MB
Platform: Linux, Unix
NovaPOS provides a dynamic and innovative approach to helping Business owners across the world organize and manage their retail Business.
The Real-Time Dashboard is the core of NovaPOS software.From here, a Business owner can see up to the minute stats and a detailed view of current sales being made. Other Charts include: Total Sales by Location, Total Sales...
Category: Business & Finance / Business Finance
Publisher: NovaPointofSale, License: Shareware, Price: USD $0.00, File Size: 2.6 MB
Platform: Windows
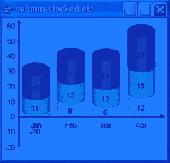
Also known as a “market map” or variable-width bar chart, a Mekko is, simply, a smart chart that can communicate up to three levels of data in a single, two-dimensional graph.
Marimekko Charts are used extensively in corporate boardrooms today because of their power to communicate complex data and concepts in a straightforward, graphical way. All Mekko Graphics...
Category: Multimedia & Design / Digital Media Editors
Publisher: Knowledge Management Associates, Inc., License: Shareware, Price: USD $0.00, File Size: 0
Platform: Windows
Growth Chart SDK - The SDK enables developers to create customized data management applications by embedding or integrating the functionality of Growth Charts into core Business applications and platforms, such as electronic medical record system. With its standards-based, Component Object Model (COM) architecture, the SDK enables our Growth Chart technology to be embedded in both...
Category: Multimedia & Design / Multimedia App's
Publisher: BV Tech Inc, License: Shareware, Price: USD $0.00, File Size: 3.3 MB
Platform: Windows
XF Rendering Server family of products can automate the creation of electronic documents like technical manuals, brochures, catalogues and marketing materials, invoices, statements and Business reports containing Charts and graphs, by dynamically generating them from any datasource including XML, databases, Web Services and more. Documents can be generated in both on-demand and in...
Category: Multimedia & Design / Multimedia App's
Publisher: Ecrion Software Inc., License: Shareware, Price: USD $0.00, File Size: 52.4 MB
Platform: Windows
Java Chart Designer is a powerful charting Java application that empowers you with all necessary tools to create Charts for professionally looking presentations, Business and scientific reports that can be easily integrated into website as Java applet, Java applications or saved as JPEG images. A user-friendly interface, great number of visual effects and predefined chart types,...
Category: Business & Finance
Publisher: ELTIMA Software GmbH, License: Shareware, Price: USD $99.95, File Size: 2.8 MB
Platform: Windows
ADSS Charts Control designed to display three types of Charts: Horizontal bar Chart, Vertical bar Chart, Pie Chart, key Features: supports Captions and Values.Text can be aligned,control allows to display text information inside and outside chart elements. Chart data can be grouped in Groups. Can be updated in real-time for creating of animated Charts. Control provides high...
Category: Software Development / Components & Libraries
Publisher: Advanced Software Solutions, License: Shareware, Price: USD $47.00, File Size: 716.8 KB
Platform: Windows
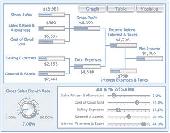
Bring your data presentation to life with Xcelsius|XL Professional. Xcelsius combines a simple “point-and-click” interface with the power of Macromedia Flash, converting data from your dull Excel spreadsheets into visually stunning and interactive dashboards, budget analysis models, Business intelligence reports, financial presentations, calculators, and more. The results are...
Category: Business & Finance
Publisher: Infommersion, Inc., License: Shareware, Price: USD $495.00, File Size: 37.6 MB
Platform: Windows
ComponentOne Studio for Silverlight is a suite of 50+ controls built on Microsoft Silverlight.
ComponentOne Studio for Silverlight is a suite of 50+ controls built on Microsoft Silverlight. With grids, Charts, reports, schedulers, editors, PDF and Excel, Studio for Silverlight includes the core line of Business controls you need. And with over 12 data visualization controls (i.e. gauges, maps, carousels, tile views, trees, 3D Charts and cover flows) you can create...
Category: Web Authoring / Web Design Utilities
Publisher: ComponentOne LLC, License: Shareware, Price: USD $0.00, File Size: 65.5 MB
Platform: Windows
AnyChart is a robust and superfast JavaScript charting library to add great-looking, interactive HTML5 Charts into any project, in any browser, and on any platform/OS including mobile ones. AnyChart provides advanced customization and flexibility opportunities, no matter if you are developing a website, a Business intelligence application (BI) for corporate usage, or some...
Category: Web Authoring / JavaScript
Publisher: AnyChart JavaScript Charts, License: Shareware, Price: USD $49.00, File Size: 17.8 MB
Platform: Windows, Mac, Linux,
Traders demand tools which are powerful, reliable, fast and easy to use.
Traders demand tools which are powerful, reliable, fast and easy to use. Netquote delivers this with the introduction of Netquote Charts, the next generation in desktop charting applications.
Netquote Charts is a fully featured technical analysis charting application. Combining sophisticated market tools in a modern easy to use interface. Best of all Netquote...
Category: Business & Finance / MS Office Addons
Publisher: Netquote Information Services Pty Ltd, License: Freeware, Price: USD $0.00, File Size: 9.1 MB
Platform: Windows
Easily track financial transactions for Business and or personal use. Track tax deductible expenses. Unlimited user defined categories and sub-categories. Choose from several pre-defined reports or create your own. Grid printing. Analyze your data with ease. View and print Charts. Easy to use short-cuts. Export data to csv and excel formats for use in other programs. Frequently...
Category: Business & Finance
Publisher: FamTec Software, License: Shareware, Price: USD $29.99, File Size: 3.7 MB
Platform: Windows
RealtimeStockreader shows you the intraday charts of your stock symbols.
RealtimeStockreader shows you the intraday Charts of your stock symbols. These Charts are being updated every minute (the updating interval can be configured).
RealtimeStockreader alerts you (acoustically) when stocks have reached limits. You can specify lower (STOP LOSS) and upper limits.
Category: Business & Finance / Business Finance
Publisher: realtimestockreader, License: Freeware, Price: USD $0.00, File Size: 69.6 KB
Platform: Windows
Flow Charting is a dedicated program designed for the creation, editing, and printing of flow Charts, org Charts, data flow diagrams, and process control Charts.
Drawing programs are great for drawings - but not for flowcharts. If you are using a drawing program or some other program with "flowcharting tools" to create your flowcharts, try Flow...
Category: Multimedia & Design / Fonts
Publisher: Patton & Patton Software Corporation, License: Shareware, Price: USD $159.00, File Size: 11.0 MB
Platform: Windows
Billing and Inventory management software utility is invoice/ billing, quotation & cashbook software for the Business. It?s very fast setup & easy to use wizard to get your first invoice out in minimum time. Preview and print reports and Charts instantly like invoice listings, sales by customer, outstanding invoice list, customer statements and more. Prepare simple...
Category: Business & Finance / Inventory Systems
Publisher: Data Recovery Forum, License: Shareware, Price: USD $45.00, File Size: 3.9 MB
Platform: Windows
When you run Timing Solution Natal Charts Viewer, you see immediately that it is totally different from other programs for natal Charts . The most programs deal with PAST explanation of movement and HOPES that the FUTURE movement repeats the patterns revealed and explained for the past. Timing Solution provides totally different approach. It is totally concentrated on the forecast...
Category: Home & Education / Astrology & Numerology
Publisher: Timing Solution, License: Freeware, Price: USD $0.00, File Size: 1.2 MB
Platform: Windows
 Shareware
FusionCharts for VB is a charting component for Microsoft Visual Basic 6.0. It allows you to render interactive and animated Charts in your Visual Basic applications. With the ability to render over 40 chart types spanning both 2D and 3D Charts, it can render a pretty face to virtually any type of data that is otherwise boring. The best part is that you do not need to know...
Category: Software Development / Components & Libraries
Publisher: InfoSoft Global (P) Ltd., License: Shareware, Price: USD $99.00, File Size: 10.0 MB
Platform: Windows
The SSChart candlestick charting software runs under Windows and Charts financial data from a variety of sources. Realtime intraday charting of futures, stocks, options, indicies and forex with data from Interactive Brokers TWS. Graphical trading from the Charts in either simulated or real mode. Realistic paper trading using real-time data.
Features:
- Historical...
Category: Business & Finance / Business Finance
Publisher: Simian Savants LLC, License: Shareware, Price: USD $50.00, File Size: 4.3 MB
Platform: Windows
Set of Php Classes for creating charts and graphs.
Set of Php Classes for creating Charts and graphs. It supports more than 18 types (linechart, piechart, barchart, radarchart, curves , gauges, 3D Charts, Candlestick, areacharts) and combinations of them. It includes a richt set of features like labels, notes, tips, multiple axis, logarithmic axis, date axis, pattern fillings, transparencies, stacked axis, stacked Charts,...
Category: Web Authoring / Web Design Utilities
Publisher: J4L Components, License: Demo, Price: USD $40.00, File Size: 1.0 MB
Platform: Windows, Linux