Free Downloads: Charts Graph Code
Data visualization solves a complicated problem of decision making in short terms. Data representation in the form of flow chart or diagram provides a true and fair concept of processes and their interconnections. But often the building of such scheme requires a lot of time and special knowledge. SharpShooter Diagrams offers a unified designer for diagrams and Charts building which...
Category: Software Development / Components & Libraries
Publisher: Perpetuum Software, License: Shareware, Price: USD $950.00, EUR776, File Size: 8.9 MB
Platform: Windows
 Demo
Demo
Imagine a complete Graphing solution assisting you right from importing data and manipulating data, plotting graphs, customizing looks, saving and exporting your graphs as high quality images and producing dynamic reports of your data in a matter of a few easy steps. Features: Data Import: Connects effortlessly with your MS SQL Server, Oracle, Access, XLS and CSV files and additionally...
Category: Software Development / Databases & Networks
Publisher: Teknowledge LLC, License: Demo, Price: USD $99.00, File Size: 8.1 MB
Platform: Windows
FCEditor .NET is an instrument for building flow Charts of programs from the Code on Pascal, Delphi and C#. The chart can be edited, saved and exported into a graphic file.
The basic FCEditor feature that makes it different from other programs of that type is the automatic layout of flow Charts and adjustment of their size to the contents.
The new version of the...
Category: Software Development / Misc. Programming
Publisher: FCEditor, License: Demo, Price: USD $9.95, File Size: 2.5 MB
Platform: Windows
Create your own custom sheets of Graph paper. You have complete control over the Graph characteristics. X and Y axis can independently be set for linear or log scale. Selection from a dozen standard paper sizes, or custom create your own. Graphs saved as pdf files you can print them whenever you wish. Choose whatever color you want for the lines. Specify independent line weights...
Category: Home & Education
Publisher: Black Cat Systems, License: Shareware, Price: USD $19.99, File Size: 1.4 MB
Platform: Windows

The Rustemsoft UIChart control enables to create iOS apps with simple, intuitive, and visually compelling chart for complex statistical or financial analysis in different Graph types that include Pie, Bar, Line, Cylinder, Area, and other chart types. You can use the UIChart control to show graphs of a small amount of data, or you can scale it to show Charts of very large sets of...
Category: Software Development / Tools & Editors
Publisher: RustemSoft, License: Shareware, Price: USD $189.99, File Size: 3.0 MB
Platform: Windows
The 2D / 3D Line Graph provides both a client and server side solution for the incorporation of line graphs and Charts into web pages. It provides versatile components so that web authors and Java developers can easily build and publish dynamic and interactive line Charts. Both the applet and servlet are designed to take multiple series of numerical data and Graph...
Category: Internet
Publisher: Sirius Computer Consultants Limited, License: Shareware, Price: USD $49.00, File Size: 384.2 KB
Platform: Windows, Linux, OS/2, Mac, Unix, MS-DOS
Whether you want to lose weight, get healthy or just monitor what you eat DietController enables you to effortlessly do all these and more. With a multi purpose calendar view, powerful food and exercise logs and customizable Charts and reports DietController has everything you need.
Not only does DietController contain all the tools to get you well on your way with your...
Category: Home & Education / Health & Nutrition
Publisher: MGDSoftware, License: Shareware, Price: USD $39.95, File Size: 7.2 MB
Platform: Windows
Graph Studio is the open source graph drawing/processing software.
Graph Studio is the open source Graph drawing/processing software. It allows users to build and process highly customizable graphs.
Category: Multimedia & Design
Publisher: sourceforge.net, License: Freeware, Price: USD $0.00, File Size: 118.0 KB
Platform: Windows, Mac, Vista
Commercial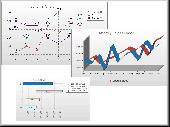
Feature Summary: 100% PHP5 Code Full PHP sourcecode available Support for PHP5 and above Chart Components for Delphi for PHP Applications Database support Direct access to URL addressable Charts Designtime PHP Form WYSIWYG Chart Control Standard Series types Extended Series types Statistical functions 2D, 3D Chart TeeChart Themes for template and colour...
Category: Software Development / Components & Libraries
Publisher: Steema Software, License: Commercial, Price: USD $149.00, File Size: 7.8 MB
Platform: Windows, Mac, Linux, Android, BlackBerry, iOS
Create spectacular Charts in your ASP.NET projects with this high-quality yet cost-effective 2D/3D chart component. Features extensive ASP.NET support including chart streaming, image maps and response, server-side events with postback, persistent states, script injection, browser detection and automatic temporary file cleanup. It provides all the chart types and capabilities you ever...
Category: Software Development
Publisher: Xceed Software Inc., License: Demo, Price: USD $399.95, File Size: 62.4 MB
Platform: Windows
Visualize your source Code with flow Charts and UML activity diagrams. Visustin Charts your Code automatically. Understand existing Code. Review algorithms. Verify program logic. Document complex procedures. Visustin flowcharts Ada, ASP, assembly language (MASM, NASM, MSP430), BASIC, C/C++, C#, Clipper, COBOL, Fortran, Java, JSP, JavaScript, LotusScript,...
Category: Software Development
Publisher: Aivosto Oy, License: Shareware, Price: USD $299.00, File Size: 3.3 MB
Platform: Windows
PeCo-Graph is the software for the procurement and graphical visualisation of the counting data from one or multiple PeCo range units. An easy-to-use application for PC that eases the download of the counting data and simplifies their analysis and graphical representation.
It has multiple Charts to easily make presentations, for instance, with comparisons of the data...
Category: Business & Finance / Business Finance
Publisher: Visual Tools S.A., License: Freeware, Price: USD $0.00, File Size: 3.3 MB
Platform: Windows
Shareware
Code to FlowChart is widely used in software development and project documentation. It can help software developer or document writer to convert source Code to flow Charts automatically. It understands and improves your algorithms on software developing. By using Code to FlowChart, you can easily know the structure of unfamiliar source Code. More than that,...
Category: Software Development / Compilers & Interpreters
Publisher: AthTek Software, License: Shareware, Price: USD $119.00, File Size: 1.5 MB
Platform: Windows
Web Enabled solution for creating Stacked Horizontal Charts & Graphs.
Web Enabled solution for creating Stacked Horizontal Charts & Graphs. Versatile components for web authors and developers to easily build and publish dynamic and interactive bar graphs. Database Access Methods (Direct Data Binding and Multi-Tier)Template Scripts and Implementations (ASP, JSP, PHP and Servlet Code)Documentation, Demo Implementations and Tutorial Guides.Dynamic...
Category: Software Development / Tools & Editors
Publisher: Sirius Computer Consultants Limited, License: Shareware, Price: USD $49.95, File Size: 252.0 KB
Platform: Windows
Commercial
FlowChart.NET adds to applications the ability to create and present various kinds of diagrams: - flowchart and process diagrams - workflow and data flow Charts - database entity-relationship diagrams - organizational and classification Charts - hierarchy and relationship diagrams - networks and graphs The basic types of diagram elements - shapes, tables, and links...
Category: Software Development / Components & Libraries
Publisher: MindFusion LLC, License: Commercial, Price: USD $300.00, File Size: 25.8 MB
Platform: Windows
Graph constructs, visualizes and modifies graphs as well as calculates measures and layouts.
Graph constructs, visualizes and modifies graphs as well as calculates measures and layouts.
CoSBiLab Graph can construct, visualize and modify graphs as well as calculate measures and layouts. CoSBiLab Graph can import and export data in a variety of formats, among which the reaction network generated by the beta WorkBench.
Category: Multimedia & Design / Multimedia App's
Publisher: CoSBi, License: Freeware, Price: USD $0.00, File Size: 3.1 MB
Platform: Windows
Add Powerful reporting features to your Web / Intranet pages and applications. With the advanced graphing package you will be quickly adding impressive dynamic charting capabilities bringing your data alive ! Powerful components provide both client & server side solutions for adding graphs & Charts into web / intranet pages & applications. Enabling web authors & Java developers to easily...
Category: Internet
Publisher: Sirius Computer Consultants Limited, License: Shareware, Price: USD $195.00, File Size: 389.6 KB
Platform: Windows, Linux, OS/2, Mac, Unix
All charts are displayed in one window.
All Charts are displayed in one window. User may compare different Charts of one stock or Charts of different stocks easily.
- Advanced indicators: EquiVolume, Point & Figure, GMMA, Heiken-Ashi, Volatility Stop Loss.
Point & Figure Charts consist of columns of X's and O's that represent filtered price movements over time. It is...
Category: Multimedia & Design / Multimedia App's
Publisher: Stock-Anal, License: Shareware, Price: USD $0.00, File Size: 0
Platform: Windows

TeeChart VCL/FMX charting library provides entire featureset to create Charts, maps and gauges in 2D, 3D for data visualization; 60+ chart styles and 50+ financial and statistical indicators. It supports Embarcadero Windows IDEs (RAD Studio, Delphi, C++ Builder) and includes native Code FireMonkey support enabling to compile applications for Windows, Mac OS, iOS/iPhone, Android....
Category: Software Development / Components: Delphi
Publisher: Steema Software, License: Shareware, Price: USD $479.00, File Size: 20.4 MB
Platform: Windows
Tool to easily follow the stock market using Point and Figure charts.
Tool to easily follow the stock market using Point and Figure Charts. Get a set of updated Charts everyday in your mailbox (or if you prefer download the Charts files from our website) We have Charts of the following markets: US US mutual funds, ETF's and iShares Canada United Kingdom Europe Australia Select stocks in minutes with our 'Buy the Winner' view! Comes...
Category: Business & Finance / Applications
Publisher: Magic Potion, License: Demo, Price: USD $49.00, File Size: 7.6 MB
Platform: Windows,
DataPlot is a program where you can import your time based data and graph it.
DataPlot is a program where you can import your time based data and Graph it.You can move easily back and forward in user defined time window, allows individual time setting for each Graph, values read directly in Graph by dragging mouse over the curve and much more
Category: Multimedia & Design / Multimedia App's
Publisher: CBIM, License: Freeware, Price: USD $0.00, File Size: 311.0 KB
Platform: Windows
Rich Chart Builder transforms your data Charts into enjoyable and captivating communication. Data Charts don't have to be plain and austere, they can be interactive experiences with attractive visuals, animation and even voice explanations describing the important facts behind the numbers. Features and Benefits: - Impressive Charts: Create stunning Rich Media...
Category: Multimedia & Design
Publisher: Blue Pacific Software, License: Shareware, Price: USD $225.00, File Size: 4.6 MB
Platform: Windows
Grab It! is a Microsoft Excel based application that digitizes graphs or Charts to obtain the original data. Graphs and Charts can have data point values digitized or photos can have angle and distance measurements made. All data is placed directly into Excel for easy re-use. Skewed graphs are handled automatically (sometimes scanning isn't perfectly straight) as well as linear,...
Category: Business & Finance
Publisher: DataTrend Software Inc, License: Demo, Price: USD $69.95, File Size: 840.1 KB
Platform: Windows
XYGraph is a native . NET charting component showing data in a cartesian graph (X,Y).
Controls from componentXtra gives royalty free software integration. Both the free and purchased products includes sample code (VB and C#). .
Category: Software Development
Publisher: componentXtra, License: Freeware, Price: USD $0.00, File Size: 390.6 KB
Platform: Windows
Animated Chart is software for Flash Charts making which enables you to create original animated Charts and publish them to your website. Animated chart solves the problem of business visualization because it offers a wide range of chart types to satisfy all your needs. Customize chart appearance simply clicking on a chart preview. Select color scheme of a chart to fit your...
Category: Web Authoring / Flash Utilities
Publisher: FeatherySoft, License: Shareware, Price: USD $69.00, File Size: 2.7 MB
Platform: Windows