Free Downloads: Charts Graphs
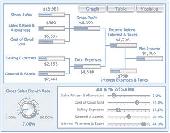
The big kahuna. It's got everything. All the functionality of Shaft Selector (SS) and Tapes And Charts (TAC), plus four additional tabs that cover ballistics Charts and Graphs, target simulation scenarios, how to accurately estimate unmarked distances, and access to some of the important system variables.
Requirements:
- Windows...
Category: Games / Simulations
Publisher: Pinwheel Software, Inc, License: Shareware, Price: USD $0.00, File Size: 0
Platform: Windows
UNaSCANaIT digitizer software works with most image formats (TIFF, JPG, BMP, GIF, etc.
UNaSCANaIT digitizer software works with most image formats (TIFF, JPG, BMP, GIF, etc.) from any scanner, digital camera, or other image source to digitize plots, strip Charts, instrumental output, old Graphs, published Graphs, etc. In addition to the many graph digitizing features, UNaSCANaIT also integrates peak areas, smoothes data, takes derivatives, reascales...
Category: Multimedia & Design / Multimedia App's
Publisher: Silk Scientific, Inc., License: Shareware, Price: USD $445.00, File Size: 12.7 MB
Platform: Windows
Chart java applet software to generate dynamic Charts and Graphs - bar, line, pie, stacked and grouped Charts in 2D and 3D with a wide range of parameters and chart types. Main features: Charts in 2D/3D, Anti aliasing, Multi language support, Cross browser compatible, Java Script parameter control, Data labels, Contextual data drill down, CSV data sources, Trend...
Category: Software Development / Tools & Editors
Publisher: Swiftchart Limited, License: Demo, Price: USD $99.00, File Size: 97.0 KB
Platform: Windows, Mac, Linux, Unix, MS-DOS, AS, 400
 Demo
Demo
Imagine a complete Graphing solution assisting you right from importing data and manipulating data, plotting Graphs, customizing looks, saving and exporting your Graphs as high quality images and producing dynamic reports of your data in a matter of a few easy steps. Features: Data Import: Connects effortlessly with your MS SQL Server, Oracle, Access, XLS and CSV files...
Category: Software Development / Databases & Networks
Publisher: Teknowledge LLC, License: Demo, Price: USD $99.00, File Size: 8.1 MB
Platform: Windows
MicroCharts delivers an intuitive Excel add-in allowing you to create richer, more concise reports and dashboards with more information per square inch. Using the latest techniques in dashboard reporting, MicroCharts helps you generate data-rich tables and Graphs as small as the size of words. This clear and simple presentation helps business professionals quickly zoom in on positive...
Category: Business & Finance
Publisher: BonaVista Systems, License: Shareware, Price: USD $49.00, File Size: 488.0 KB
Platform: Windows
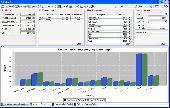
ESBStats is a mathematical and statistical software package, which is designed to meet the analytical needs of students, teachers and corporate users. It provides you with many statistical procedures and routines like Deciles, Grand Mean, Quartiles, Standard Deviation, Residuals, Geometric Mean, Hypothesis Analysis, Linear Regression Analysis, Multiple Regression Analysis and many more....
Category: Business & Finance / Applications
Publisher: ESB Consultancy, License: Shareware, Price: USD $79.00, File Size: 6.6 MB
Platform: Windows
XF Rendering Server family of products can automate the creation of electronic documents like technical manuals, brochures, catalogues and marketing materials, invoices, statements and business reports containing Charts and Graphs, by dynamically generating them from any datasource including XML, databases, Web Services and more. Documents can be generated in both on-demand and in...
Category: Multimedia & Design / Multimedia App's
Publisher: Ecrion Software Inc., License: Shareware, Price: USD $0.00, File Size: 52.4 MB
Platform: Windows

Chart java applet software to generate dynamic Charts and Graphs - bar, line, pie, stacked and grouped Charts in 2D and 3D with a wide range of parameters and chart types. Main features: Charts in 2D/3D, Anti aliasing, Multi language support, Cross browser compatible, Java Script parameter control, Data labels, Contextual data drill down, CSV data sources, Trend...
Category: Multimedia & Design
Publisher: Swiftchart Limited, License: Demo, Price: USD $99.00, File Size: 97.7 KB
Platform: Windows, Mac, Linux, Unix, MS-DOS, AS/400
Drawing graphs without the right tool is simply difficult.
Drawing Graphs without the right tool is simply difficult. uDraw(Graph) automates this task for you. Find out how uDraw(Graph) creates your flow Charts, diagrams, hierarchies or structure visualizations using automatic layout - much faster than with any standard drawing program. With the API, uDraw(Graph) can even be embedded in your own programs as a visualization component.
Category: Multimedia & Design / Image Editing
Publisher: University Bremen, FB3, Germany, License: Freeware, Price: USD $0.00, File Size: 2.6 MB
Platform: Windows
Chart java applet software to generate dynamic Charts and Graphs within JSP, servlets or java applications - bar, line, pie, stacked and grouped Charts in 2D and 3D with a wide range of parameters and chart types. Main features: Charts in 2D/3D, Anti aliasing, Multi language support, Cross browser compatible, Java Script parameter control, Data labels, Contextual...
Category: Software Development / Tools & Editors
Publisher: Swiftchart Limited, License: Demo, Price: USD $99.00, File Size: 97.0 KB
Platform: Windows, Mac, Linux, Unix, MS-DOS, AS, 400

Chart java applet software to generate dynamic Charts and Graphs within JSP, servlets or java applications - bar, line, pie, stacked and grouped Charts in 2D and 3D with a wide range of parameters and chart types. Main features: Charts in 2D/3D, Anti aliasing, Multi language support, Cross browser compatible, Java Script parameter control, Data labels, Contextual...
Category: Software Development
Publisher: Swiftchart Limited, License: Demo, Price: USD $99.00, File Size: 97.7 KB
Platform: Windows, Mac, Linux, Unix, MS-DOS, AS/400
Combine the Abbot Diabetes Care CoPilot™ Health Management System and the OmniPod Extension software to create customized Charts and Graphs of the data from your PDM.
By teaming the CoPilot Health Management System with the OmniPod Extension software you can:
Download insulin, BG and carbohydrate records from your PDM to your computer.
Upload...
Category: Home & Education / Health & Nutrition
Publisher: Insulet Corp., License: Freeware, Price: USD $0.00, File Size: 343.6 KB
Platform: Windows
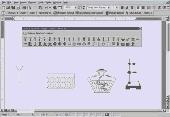
Science Teacher Helper is an add-on for Microsoft Word, it was designed with a single purpose in mind - to save you time when editing Graphs and Charts of math, chemistry and physics in documents. You can easily add 765 functions, Graphs and Charts of physical, chemical and math into your MS WORD document.
Science Teacher Helper offers the user a wide rage of...
Category: Business & Finance / Applications
Publisher: helpscience Inc, License: Shareware, Price: USD $39.95, File Size: 743.0 KB
Platform: Windows
All charts are displayed in one window.
All Charts are displayed in one window. User may compare different Charts of one stock or Charts of different stocks easily.
- Advanced indicators: EquiVolume, Point & Figure, GMMA, Heiken-Ashi, Volatility Stop Loss.
Point & Figure Charts consist of columns of X's and O's that represent filtered price movements over time. It is...
Category: Multimedia & Design / Multimedia App's
Publisher: Stock-Anal, License: Shareware, Price: USD $0.00, File Size: 0
Platform: Windows
Tool to easily follow the stock market using Point and Figure charts.
Tool to easily follow the stock market using Point and Figure Charts. Get a set of updated Charts everyday in your mailbox (or if you prefer download the Charts files from our website) We have Charts of the following markets: US US mutual funds, ETF's and iShares Canada United Kingdom Europe Australia Select stocks in minutes with our 'Buy the Winner' view! Comes...
Category: Business & Finance / Applications
Publisher: Magic Potion, License: Demo, Price: USD $49.00, File Size: 7.6 MB
Platform: Windows,
Fast, Powerful and Flexible, E-Tabs Enterprise automates the production of Charts, Graphs, and summary reports directly from your research data. Automating your reporting with Enterprise ensures accuracy and saves time because manual tasks that leave room for error such as hand entry or tools offering only partial automation are no longer necessary.Any researcher will be aware of...
Category: Audio / Utilities & Plug-Ins
Publisher: E-Tabs, License: Demo, Price: USD $0.00, File Size: 139.1 KB
Platform: Windows
HanengCharts enables you to easily add customized, dynamic, interactive Charts to your Web site, intranet or Web application. No installation is required on the server, simply upload the small JAR file (80Kb) to the same folder as your Web page, add a few lines of HTML code and you have your first chart. Use any technology that can output HTML (like ASP.Net, ASP, PHP, JSP, ColdFusion...
Category: Internet
Publisher: Haneng Consult, License: Demo, Price: USD $399.00, File Size: 1.0 MB
Platform: Windows, Mac, Linux, Unix
Bring your data presentation to life with Xcelsius|XL Professional. Xcelsius combines a simple âpoint-and-clickâ interface with the power of Macromedia Flash, converting data from your dull Excel spreadsheets into visually stunning and interactive dashboards, budget analysis models, business intelligence reports, financial presentations, calculators, and more. The results are compelling,...
Category: Business & Finance
Publisher: Infommersion, Inc., License: Shareware, Price: USD $495.00, File Size: 37.6 MB
Platform: Windows
Shareware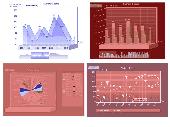
FlyCharts is a flash Charts component, which is a set of Adobe Flash (SWF) files that gives you outstanding possibility to visualize your data. FlyCharts help create compact, interactive flash Charts and Graphs fast and easy. FlyCharts doesn't need installation, runs without using an Active-X component, reduces load on the server, works with any scripting language and can...
Category: Web Authoring / Flash Utilities
Publisher: Origramy, License: Shareware, Price: USD $99.00, File Size: 452.0 KB
Platform: Windows, Mac, Linux
SD-Graph v1.0 is a sophisticated bar graphing system that allows you to create and display colorful bar charts with detailed statistics.
Category: Software Development
Publisher: Spriteworks Developments, License: Demo, Price: USD $14.95, File Size: 18.1 KB
Platform: Unknown
Rich Chart Builder transforms your data Charts into enjoyable and captivating communication. Data Charts don't have to be plain and austere, they can be interactive experiences with attractive visuals, animation and even voice explanations describing the important facts behind the numbers. Features and Benefits: - Impressive Charts: Create stunning Rich Media...
Category: Multimedia & Design
Publisher: Blue Pacific Software, License: Shareware, Price: USD $225.00, File Size: 4.6 MB
Platform: Windows
Qualitek-4 from Nutek, Inc. automatically designs experiments based on user-indicated factors and levels. The program selects the array and assigns the factors to the appropriate column. For more complex experiments, there is a manual design option. The program also performs the three basic steps in analysis: main effect, analysis-of-variance, and optimum studies. Analysis can be performed...
Category: Business & Finance / Business Finance
Publisher: Nutek Inc, License: Shareware, Price: USD $1996.00, File Size: 6.7 MB
Platform: Windows
Budget Ace is used to budget your personal finances and track your spendings. The program has Graphs and reports to give you a visual representation of your budget. The program simply allows you to enter your paycheck information for each month. You can create categories and budget spendings for each of those categories. The program allows you to copy categories and paycheck information...
Category: Home & Education / Miscellaneous
Publisher: Walltech Software, License: Demo, Price: USD $9.99, File Size: 6.7 MB
Platform: Windows
WpfDiagram adds to applications the ability to create and present various kinds of diagrams: - flowchart and process diagrams - workflow and data flow Charts - database entity-relationship diagrams - organizational and classification Charts - hierarchy and relationship diagrams - networks and Graphs The basic types of diagram elements - boxes, tables, and arrows - can be...
Category: Software Development / Components & Libraries
Publisher: MindFusion LLC, License: Commercial, Price: USD $500.00, File Size: 6.4 MB
Platform: Windows
OfficeReports Link links data from Excel ranges to native PowerPoint tables, Charts and shapes. This can be done in such a way, so backgroundcolors from Excel cells are shown as logos and icons in PowerPoint. The Excel ranges can have a variable number of rows and/or columns, and OfficeReports is integrated with Excels and PowerPoints Macro engine. Microsoft Office already contains...
Category: Business & Finance / Business Finance
Publisher: OfficeReports, License: Shareware, Price: USD $39.00, File Size: 609.0 KB
Platform: Windows