Free Downloads: Create Economic Graphs
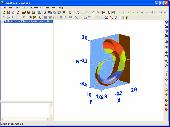
RLPlot is is a plotting program to create high quality graphs from data.
RLPlot is is a plotting program to Create high quality Graphs from data. Based on values stored in a spreadsheet several menus help you to Create Graphs of your choice. The Graphs are displayed as you get them (Wysiwyg). Double click any element of the gr
Category: Multimedia & Design
Publisher: rlplot.sourceforge.net, License: Freeware, Price: USD $0.00, File Size: 1024.0 KB
Platform: Windows, Mac, 2K, 2K3
This software incorporates the database of the Economic Freedom of the World report and all statistics in the World Bank Development Indicators.
Together they form a powerful database allowing comparison of Economic freedom with statistics that people care about: health, wealth, education and 500 other variables. The software allows country statistics to be selected,...
Category: Business & Finance / Business Finance
Publisher: The Fraser Institute, License: Freeware, Price: USD $0.00, File Size: 35.7 MB
Platform: Windows
Acuity Brands Lighting’s Economic Viewer software allows the user to perform simple financial comparisons between lighting alternatives. Whether investigating the economics of a renovation project or deciding between several options in a new construction project, the Economic Viewer considers both initial and annual costs to determine payback periods and internal rate of...
Category: Business & Finance / Business Finance
Publisher: Lithonia Lighting, License: Freeware, Price: USD $0.00, File Size: 4.2 MB
Platform: Windows
Stock Risk Wizard provides unique statistical and Economic analysis of over 20,000 current stocks, mutual funds, and indexes. Using patented Eta Analysis, you can easily see the Economic risks associated with a given asset. Stock Risk Wizard also allows you to determine how much hidden Economic risk is present in a portfolio, or which stocks are more likely to be helped (or...
Category: Business & Finance / Business Finance
Publisher: EconomicInvestor, License: Freeware, Price: USD $0.00, File Size: 2.4 MB
Platform: Windows
LV Information System is a software for companies to have a complete view of economic activities.
LV Information System is a software for companies to have a complete view of Economic activities. FEATURES OF LV INFORMATION SYSTEM: Customers Clean data abour all your customers. Invoices You can add all your invoices also with scanned images. Inventory All your inventory items with huge details. Employees Complete Employees data with editable accesses. Expenses...
Category: Business & Finance / Business Finance
Publisher: LV Stav s r.o., License: Demo, Price: USD $550.00, File Size: 595.1 KB
Platform: Windows
SheepSim simulates selection and management in an economic context.
SheepSim simulates selection and management in an Economic context. It is based upon the STAR management system but the flocks can be managed to have from one to five breeding seasons a year.
Features :
- Sidebar - the current state of your project and advance time in the simulation.
- Topbar - navigate options for loading projects, as well as options...
Category: Business & Finance / Business Finance
Publisher: Cornell University, License: Freeware, Price: USD $0.00, File Size: 2.4 MB
Platform: Windows
EasyGrapher Home is computer software for needlework designers who want to design cross stitch Graphs using an array of powerful editing features. With it you can Create Graphs from scratch and convert scanned pictures or clipart with automatic color matching.
EasyGrapher Home prints professional quality Graphs in either color or black and white using a...
Category: Multimedia & Design / Multimedia App's
Publisher: Davis Computer Services, Inc., License: Shareware, Price: USD $99.00, File Size: 7.6 MB
Platform: Windows
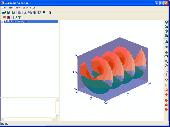
Visual Complex is a graph software to Create graph of complex function. 3D function Graphs and 2D color maps can be created with this grapher. You can input complex functions in the form of w=f(z) (where z=x+yi) directly before creacting Graphs. Graphs can be copied and saved in the format of bitmap.Complex Grapher is a graphing calculator to Create a graph of...
Category: Home & Education / Mathematics
Publisher: GraphNow, License: Demo, Price: USD $30.00, File Size: 1.9 MB
Platform: Windows
Grapher is the ultimate technical graphing package available.
Grapher is the ultimate technical graphing package available.
Choose from several specialty graph types, including ternary, box-whisker, bubble plots, pie charts, and hi-low-close plots.
Wow your audience every time they see your Graphs. Create one of 54 unique graph types.
This easy-to-use, powerful, dynamic program will help you...
Category: Multimedia & Design / Multimedia App's
Publisher: Golden Software, License: Shareware, Price: USD $0.00, File Size: 34.0 MB
Platform: Windows
PHDWin is a full-featured economic and decline curve analysis program.
PHDWin is a full-featured Economic and decline curve analysis program. PHDWin offers evaluators a tool that combines an intuitive interface with sophisticated functionality. This increases the overall efficiency of the evaluation process, allowing you to spend more time finding opportunities.
Category: Business & Finance / Business Finance
Publisher: TRC Consultants, LC, License: Demo, Price: USD $0.00, File Size: 87.9 MB
Platform: Windows
Graphs are helpful when one needs to visually share complex analytical information or when one needs to show the broader trends in the data. This Interactive Graphs pack helps people to understand data quickly and focus on the points a presenter wants to specifically highlight. It includes 3D effects along with various interactive features such as auto build-up, graph reading,...
Category: Multimedia & Design / Multimedia App's
Publisher: Harbinger Knowledge Products, License: Shareware, Price: USD $199.00, File Size: 18.2 MB
Platform: Windows
CurveUnscan makes easier, faster and more accurate the reverse engineering of graphs into data.
CurveUnscan makes easier, faster and more accurate the reverse engineering of Graphs into data.
Extracting data from Graphs is necessary for :
- Comparing data presented on Graphs in the litterature / internet with your own data
- Comparing different authors who present their results in Graphs.
- Refactoring documentation...
Category: Software Development / Misc. Programming
Publisher: SquarePoint Software, License: Shareware, Price: USD $72.17, File Size: 3.1 MB
Platform: Windows
Complex Grapher is a graphing calculator to Create a graph of complex function. 3D function Graphs and 2D color maps can be created with this grapher. You can input complex functions in the form of w=f(z) (where z=x+yi) directly before creacting Graphs. Graphs can be copied and saved in the format of bitmap.Complex Grapher is a graphing calculator to Create a...
Category: Home & Education
Publisher: GraphNow, License: Shareware, Price: USD $19.95, File Size: 976.6 KB
Platform: Windows
Measure the response times of servers and create performance graphs.
Measure the response times of servers and Create performance Graphs. The text, XML, HTML, SVG and RTF formats are supported. You may also be notified via email, or run any Windows application if an alarm occurs. The Network Supervisor may notify you if a server goes down etc.
Category: Internet / Monitoring
Publisher: MHC, License: Commercial, Price: USD $2495.00, File Size: 1.5 MB
Platform: Windows
Visual Complex is a graph software to create graphs of complex variable functions.
Visual Complex is a graph software to Create Graphs of complex variable functions.
Features:
-Creating 3D Graphs of complex functions
-Creating color maps of complex functions
-Ability to edit graph interactively
-Ability to copy and save graph as bitmap.
Category: Multimedia & Design / Multimedia App's
Publisher: GraphNow Software, License: Shareware, Price: USD $25.00, File Size: 2.0 MB
Platform: Windows
PEST analysis, PESTLE/PESTEL, PESTEL, PESTLIED, Political, Economic, Social, Technological, Legal, International, Environmental, Demographic, STEEPLE - Social/Demographic, Technological, Economic, Environmental, Political, Legal, Ethical, SLEPT
Category: Business & Finance / Applications
Publisher: www.clickok.co.uk/PESTLIED/pay.html, License: Shareware, Price: USD $25.00, File Size: 1.6 MB
Platform: Windows
DPLOT95 is a software for creating and manipulating graphs in 1, 2, 3, and 4-D.
DPLOT95 is a software for creating and manipulating Graphs in 1, 2, 3, and 4-D. With its help you you can Create presentation-quality Graphs as well as contour plots of 3-D and 4-D data while using data from a variety of sources. You can use multiple scaling types, including linear, logarithmic, and probability scales on the X and/or Y axes. DPlot also provides several...
Category: Multimedia & Design / Multimedia App's
Publisher: USAERDC, License: Shareware, Price: USD $195.00, File Size: 9.9 MB
Platform: Windows
Powerful but easy-to-use graphing, curve fitting and calculating software. Graphs Cartesian (Y(x) and X(y)), polar and parametric functions, Graphs of tables, equations (implicit functions), inequalities and slope fields. Up to 100 Graphs in one window. Calculus features: regression analysis, obtaining zeroes and extrema of functions, intersections, derivatives, equations...
Category: Home & Education
Publisher: Alentum Software, Inc., License: Shareware, Price: USD $29.95, File Size: 1.1 MB
Platform: Windows
mxGraph is a product family of libraries, written in a variety of technologies, that provide features aimed at applications that display interactive diagrams and Graphs. Note by Graphs we mean mathematical Graphs, not necessarily charts (although some charts are Graphs). See later section “What is a Graph?” for more details.
Category: Multimedia & Design / Digital Media Editors
Publisher: JGraph Ltd, License: Shareware, Price: USD $0.00, File Size: 0
Platform: Windows
Mangodata is a powerful yet easy to use multi-user database for education.
Mangodata is a powerful yet easy to use multi-user database for education. It allows pupils to easily Create a database, enter information and then search the data to display results through a range of Graphs.
This information might include a class survey, historical census information or perhaps the results of a scientific investigation. There is a...
Category: Home & Education / Miscellaneous
Publisher: MightyMango, License: Shareware, Price: USD $0.00, File Size: 0
Platform: Windows
The forex market is many times dominated by important economic reports releases.
The forex market is many times dominated by important Economic reports releases. These government issued reports can sometimes cause 150-200 pips moves in certain currency pairs within minutes. We tell you in Fire Forex Trading Programs how to reap these sure winners and put additional money into your pockets.
It was developed by a mathematics professor, a behavioral psychologist and...
Category: Business & Finance / Business Finance
Publisher: Fire Forex Trading Programs, License: Shareware, Price: USD $35.95, File Size: 6.0 MB
Platform: Windows
Function Grapher is an easy-to-use software to Create 2D, 2.5D, 3D function Graphs, animations and table Graphs. 2D Features: explicit, implicit, parametric, and in equation; Cartesian and polar coordinate systems; curve and animation; graph of inverse function and derivative function; parity; maximum, minimum, and inflexion; integration; root; the length of curve; tangent...
Category: Home & Education / Mathematics
Publisher: GraphNow, License: Shareware, Price: USD $39.95, File Size: 2.9 MB
Platform: Unknown


 Shareware
NewsAutoTrader is a Forex news spike trading tool that generates trade signals by reading and analyzing live news headlines. Using it you can trade many Economic indicators, such as US Nonfarm Payrolls, GDP, CPI, Retail Sales, Interest rate announcements, and other news releases that impact the Forex market (including Binary Options). It can be useful for other markets too, such as...
Category: Business & Finance / Applications
Publisher: Xangi Software, License: Shareware, Price: USD $230.00, File Size: 1.6 MB
Platform: Windows
REDD Abacus SP is ABAtement Cost cUrveS generator from an opportunity cost estimation analysis on Reducing Emission from Deforestation, and Degradation.
Opportunity costs refer to the potential Economic gains that could be made if certain types of land use change are not happening.
If the opportunity costs are low relative to the amount of emission reduction that can...
Category: Business & Finance / Business Finance
Publisher: World Agroforestry Center, License: Demo, Price: USD $0.00, File Size: 24.0 MB
Platform: Windows
The Plot control created to display graphs and charts on .
The Plot control created to display Graphs and charts on .NET Windows Forms. Advantages of this control are very quick embedding into your application and powerful features. Written using 100% managed code. Also, this control can be used to Create animated Graphs. With this control You can: draw lines just from arrays, use gradients to fill lines colors, draw histograms...
Category: Software Development / Components & Libraries
Publisher: Advanced Software Solutions, License: Shareware, Price: USD $19.00, File Size: 1.1 MB
Platform: Windows

