Free Downloads: Data Charts
Operates in English (I-P) or metric (SI) units.
Operates in English (I-P) or metric (SI) units.
Create high quality, customized psychrometric Charts.
Plot your process Data with state point labels.
Print a report of state points and processes.
Add notes and annotations.
Define and plot zones on your Charts, (e.g. comfort zones)
Copy/paste Charts to your presentation or word...
Category: Multimedia & Design / Digital Media Editors
Publisher: Linric Company, License: Shareware, Price: USD $149.95, File Size: 20.2 MB
Platform: Windows
 Shareware
FusionCharts for Flex is a charting component for Adobe Flex solutions. It helps you create interactive Charts and graphs in your Flex projects. The Charts are powered by FusionCharts v3 framework - the industry leader in Adobe Flash Charting. FusionCharts for Flex offers over 45 chart types spanning both 2D and 3D Charts, including: * Standard Charts like...
Category: Software Development / Components & Libraries
Publisher: InfoSoft Global (P) Ltd., License: Shareware, Price: USD $299.00, ALL1499, File Size: 14.5 MB
Platform: Windows, Mac, Linux, Unix
All charts are displayed in one window.
All Charts are displayed in one window. User may compare different Charts of one stock or Charts of different stocks easily.
- Advanced indicators: EquiVolume, Point & Figure, GMMA, Heiken-Ashi, Volatility Stop Loss.
Point & Figure Charts consist of columns of X's and O's that represent filtered price movements over time. It is...
Category: Multimedia & Design / Multimedia App's
Publisher: Stock-Anal, License: Shareware, Price: USD $0.00, File Size: 0
Platform: Windows
The SSChart candlestick charting software runs under Windows and Charts financial Data from a variety of sources. Realtime intraday charting of futures, stocks, options, indicies and forex with Data from Interactive Brokers TWS. Graphical trading from the Charts in either simulated or real mode. Realistic paper trading using real-time Data.
Category: Business & Finance / Business Finance
Features:
Publisher: Simian Savants LLC, License: Shareware, Price: USD $50.00, File Size: 4.3 MB
Platform: Windows
EasyCharts is a complete library of java chart components, chart applets, and chart servlets that enable programmers to add Charts and graphs in java applications, web applications, and web pages with just a few lines of code. The java chart library includes bar Charts, line Charts, and pie Charts and is highly configurable. The java chart library supports...
Category: Software Development
Publisher: ObjectPlanet, Inc., License: Demo, Price: USD $450.00, File Size: 2.8 MB
Platform: Windows, Mac, Linux, Unix, Java
Your objective is to use one software system to collect bathymetry, sonar Data and magnetometer Data, process this Data, produce Charts or even produce S-57 Electronic Navigation Charts(ENC).
QINSy is a suite of hydrographic applications that covers that whole range of activities, from Data acquisition to chart production.
Category: Business & Finance / Business Finance
Publisher: QPS, License: Shareware, Price: USD $0.00, File Size: 0
Platform: Windows
Tool to easily follow the stock market using Point and Figure charts.
Tool to easily follow the stock market using Point and Figure Charts. Get a set of updated Charts everyday in your mailbox (or if you prefer download the Charts files from our website) We have Charts of the following markets: US US mutual funds, ETF's and iShares Canada United Kingdom Europe Australia Select stocks in minutes with our 'Buy the Winner' view! Comes...
Category: Business & Finance / Applications
Publisher: Magic Potion, License: Demo, Price: USD $49.00, File Size: 7.6 MB
Platform: Windows,
Shareware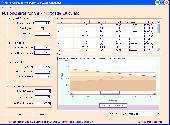
FusionCharts for VB is a charting component for Microsoft Visual Basic 6.0. It allows you to render interactive and animated Charts in your Visual Basic applications. With the ability to render over 40 chart types spanning both 2D and 3D Charts, it can render a pretty face to virtually any type of Data that is otherwise boring. The best part is that you do not need to...
Category: Software Development / Components & Libraries
Publisher: InfoSoft Global (P) Ltd., License: Shareware, Price: USD $99.00, File Size: 10.0 MB
Platform: Windows
ELChart library is the powerful tool that allows to create programs with various charts.
ELChart library is the powerful tool that allows to create programs with various Charts. Library offers flexible GDI based solution that allows you to create animated, compact and great looking Charts.With ELChart you you can create various Charts such as financial Charts, mathematical plots, diagrams etc, save chart to BMP file, create linear-law and square-law...
Category: Software Development / ActiveX
Publisher: ELSoft, License: Shareware, Price: USD $49.00, File Size: 819.2 KB
Platform: Windows
TMS Advanced Charts is available as VCL component set for Win32 application development and can be used as well with VCL for the Web (IntraWeb).
The TMS Advanced Charts is designed to display different kinds of Data.
TMS Advanced Charts is a component set which includes components such as TAdvChartView, TDBAdvChartView, TAdvChartViewGDIP (GDI ),...
Category: Web Authoring / Web Design Utilities
Publisher: tmssoftware, License: Shareware, Price: USD $100.08, File Size: 9.2 MB
Platform: Windows
Rich Chart Builder transforms your Data Charts into enjoyable and captivating communication. Data Charts don't have to be plain and austere, they can be interactive experiences with attractive visuals, animation and even voice explanations describing the important facts behind the numbers. Features and Benefits: - Impressive Charts: Create stunning Rich...
Category: Multimedia & Design
Publisher: Blue Pacific Software, License: Shareware, Price: USD $225.00, File Size: 4.6 MB
Platform: Windows
Rapid Charts provides the tools you need to help make creating Charts and graphs for use in web sites or applications as straightforward as possible. Chart definitions allow you to easily save the chart for later use, save the definition to a shared database to share the chart with others or for use in a web page. Charts can be saved to a jpg or png file for inclusion in...
Category: Audio / Utilities & Plug-Ins
Publisher: LLamedos Software, License: Shareware, Price: USD $14.95, File Size: 4.2 MB
Platform: Windows
Grab It! is a Microsoft Excel based application that digitizes graphs or Charts to obtain the original Data. Graphs and Charts can have Data point values digitized or photos can have angle and distance measurements made. All Data is placed directly into Excel for easy re-use. Skewed graphs are handled automatically (sometimes scanning isn't perfectly straight)...
Category: Business & Finance
Publisher: DataTrend Software Inc, License: Demo, Price: USD $69.95, File Size: 840.1 KB
Platform: Windows
OCENS MetMapper transforms weather maps, satellite images, and ocean Charts, into dynamic components of your at-sea decision-making tool box. MetMapper offers to all non-GRIB Data what our GRIB Explorer software does for the GRIB Data. That is, it will take classical weather Data such as weather Charts, ocean Charts and satellite imagery and render them...
Category: Home & Education / Miscellaneous
Publisher: OCENS, Inc., License: Shareware, Price: USD $169.00, File Size: 23.6 MB
Platform: Windows
Chart Trainer -Learn to read nautical charts like an expert.
Chart Trainer -Learn to read nautical Charts like an expert.
Chart Trainer is designed to help mariners interpret nautical Charts and use them more efficiently, both traditional paper Charts and new digital Charts for computers. The materials cover all aspects of nautical Charts in the most detail available, including tutorials on chart reading and...
Category: Home & Education / Teaching Tools
Publisher: Starpath School of Navigation, License: Shareware, Price: USD $39.00, File Size: 39.8 MB
Platform: Windows
OfficeReports Link links Data from Excel ranges to native PowerPoint tables, Charts and shapes. This can be done in such a way, so backgroundcolors from Excel cells are shown as logos and icons in PowerPoint. The Excel ranges can have a variable number of rows and/or columns, and OfficeReports is integrated with Excels and PowerPoints Macro engine. Microsoft Office already...
Category: Business & Finance / Business Finance
Publisher: OfficeReports, License: Shareware, Price: USD $39.00, File Size: 609.0 KB
Platform: Windows
The QI Macros SPC Software for Excel draws pareto Charts, control Charts, histograms, box and whisker plots, scatter plots and more. There are four "wizards" that figure out what chart or statistic to draw based on your Data. Better yet we do it right in Excel. Your just select your Data and then select the chart from the QI Macros menu. It also includes...
Category: Business & Finance / MS Office Addons
Publisher: KnowWare International, Inc., License: Shareware, Price: USD $199.00, File Size: 12.7 MB
Platform: Windows
Flow Charting is a dedicated program designed for the creation, editing, and printing of flow Charts, org Charts, Data flow diagrams, and process control Charts.
Drawing programs are great for drawings - but not for flowcharts. If you are using a drawing program or some other program with "flowcharting tools" to create your flowcharts, try Flow...
Category: Multimedia & Design / Fonts
Publisher: Patton & Patton Software Corporation, License: Shareware, Price: USD $159.00, File Size: 11.0 MB
Platform: Windows
JFreeChart is a free Java class library for generating Charts (GNU LGPL). Support is included for: pie Charts, bar Charts, line Charts, scatter plots, time series Charts, candlestick Charts, high-low-open-close Charts and more. Use in applications, servlets, JSP or applets. Export to PNG, JPEG, PDF, SVG and HTML image maps. Complete source...
Category: Software Development
Publisher: Object Refinery Limited, License: Freeware, Price: USD $0.00, File Size: 5.3 MB
Platform: Windows, Linux, Unix
Sigma XL is a Microsoft Excel third-party add-in that allows statistical professionals to enhance basic Excel's Charts and reports. Excel is the common application to enter Data and gather most numerical information, however, its statistical reports functionality is limited, as the Data must be exported to other application to get specific reports/Charts.
...
Category: Business & Finance / Applications
Publisher: SigmaXL, License: Shareware, Price: USD $249.00, File Size: 47.7 MB
Platform: Windows
FCharts SE is a free stock charting program which will import price Data from a wide range of sources, displaying it as OHLC, Candlestick and Line Charts. It has a number of built-in indicators (MACD, RSI, Exponential and Standard Moving Averages), or you can write your own with the inbuilt formula language and display them as standalone Charts or overlays. You can draw...
Category: Business & Finance / Business Finance
Publisher: Spacejock Software, License: Freeware, Price: USD $0.00, File Size: 3.1 MB
Platform: Windows
Dashboard tools for Excel helps you to understand complex relationships in your Excel data.
Dashboard tools for Excel helps you to understand complex relationships in your Excel Data. With Mini Charts you can use Sparklines, Heatmaps, Mini Charts and Bump Charts, getting dramatically improved Data visualization for fast and effective parallel comparisons.
Dashboard tools works with Excel personalization options. Because it has been...
Category: Business & Finance / MS Office Addons
Publisher: JABSOFT, License: Shareware, Price: USD $0.00, File Size: 0
Platform: Windows

Easy to creates dynamic Charts in the Macromedia Flash SWF format. Jobdao Flash Chart can transforms your Data Charts into enjoyable and captivating communication. Data Charts don't have to be plain and austere, they can be interactive experiences with attractive visuals and animation.We offer a number of other advanced features: Jobdao Flash Chart...
Category: Multimedia & Design
Publisher: JobdaoNet, License: Shareware, Price: USD $39.00, File Size: 144.7 KB
Platform: Windows
Displays Dukascopy charts for several currency pairs.
Displays Dukascopy Charts for several currency pairs. Resizeable, six chart periods, four chart types and a choice of optional indicators. Flat periods may be removed from the Charts by selecting a check box.
Category: Business & Finance / Business Finance
Publisher: Chris Craig, License: Freeware, Price: USD $0.00, File Size: 173.0 KB
Platform: Unknown
MeasurLink is designed for customers who want to acquire and analyze Data in real-time and check variable and attribute inspection to maximize production and minimize defects. It has views to allow the user to create Parts, Characteristics with nominal and tolerance and Traceability lists. The Data collection interface provides real-time graphics for Run Charts, Control...
Category: Business & Finance / Business Finance
Publisher: Mitutoyo America, License: Demo, Price: USD $0.00, File Size: 231.8 MB
Platform: Windows