Free Downloads: Data Graph Plot
 Shareware
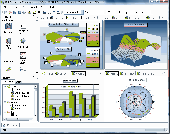
DataScene is a Data graphing, animation, and analysis software package. It allows the user to easily Plot 2D & 3D graphs (Area, Bar, Pie, Line, Surface, Ploar, and more) with scientific, financial, and statistical Data, to manipulate, print, and export high quality graphs, to analyze Data with various mathematical methods (fitting curves, calculating statics, FFT,...
Category: Multimedia & Design / Authoring Tools
Publisher: CyberWit, Inc., License: Shareware, Price: USD $219.00, File Size: 44.1 MB
Platform: Windows
If you are searching for a computer program that can Plot simple graphs on your PC, GraphSight Junior is what you are looking for. This utility is feature rich and comprehensive. It plots 2D graphs with easy navigation, and it’s well suited for high school and college math students.
It can Plot Cartesian, polar, table defined, as well as specialty graphs, such as...
Category: Home & Education / Mathematics
Publisher: CradleFields.com, License: Freeware, Price: USD $0.00, File Size: 417.5 KB
Platform: Windows
New Features of DataStudio:
- Video Player and Synchronization -- Play a movie or synch a movie to experimental Data
- Presentation Style Graph -- Additional Graph style that moves measurements and units outside the Graph; ideal for publication of DataStudio graphs in educational journals
- Predictive Sketching -- Students can draw directly on the...
Category: Home & Education / Miscellaneous
Publisher: PASCO, License: Demo, Price: USD $0.00, File Size: 32.8 MB
Platform: Windows
The WebViewer plug-in enables Windows users whether or not they have SigmaPlot to explore the Data used to create the Graph.
Category: Multimedia & Design / Graphics Viewers
Using the WebViewer plug-in with your Web browser window you can:
- View the Data used to create the Graph
- Print a Graph in a web document at full resolution
- Zoom in and out of a Graph
Publisher: SYSTAT Software Inc., License: Freeware, Price: USD $0.00, File Size: 12.6 MB
Platform: Windows
Chart java applet software to generate dynamic charts and graphs within JSP, servlets or java applications - bar, line, pie, stacked and grouped charts in 2D and 3D with a wide range of parameters and chart types. Main features: Charts in 2D/3D, Anti aliasing, Multi language support, Cross browser compatible, Java Script parameter control, Data labels, Contextual Data drill down,...
Category: Software Development / Tools & Editors
Publisher: Swiftchart Limited, License: Demo, Price: USD $99.00, File Size: 97.0 KB
Platform: Windows, Mac, Linux, Unix, MS-DOS, AS, 400
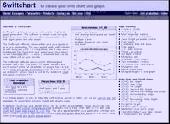
Chart java applet software to generate dynamic charts and graphs within JSP, servlets or java applications - bar, line, pie, stacked and grouped charts in 2D and 3D with a wide range of parameters and chart types. Main features: Charts in 2D/3D, Anti aliasing, Multi language support, Cross browser compatible, Java Script parameter control, Data labels, Contextual Data drill down,...
Category: Software Development
Publisher: Swiftchart Limited, License: Demo, Price: USD $99.00, File Size: 97.7 KB
Platform: Windows, Mac, Linux, Unix, MS-DOS, AS/400
LAB Fit is a software for Windows developed for treatment and analysis of experimental data.
LAB Fit is a software for Windows developed for treatment and analysis of experimental Data. At LABFit program you are able to:
1) Treat similar Data (grouped and ungrouped dataset, one or two samples);
2) Treat non-similar Data;
3) Determine propagated error (error propagation up to eight independent variables);
4) Plot 2D and 3D Graph...
Category: Home & Education / Science
Publisher: Wilton Pereira da Silva, License: Shareware, Price: USD $60.00, File Size: 3.3 MB
Platform: Windows
The primary purpose of XL-Plot is to create a figure rapidly.
The primary purpose of XL-Plot is to create a figure rapidly. It is ideal for for use at high school, as the path from Data in one or more spreadsheet columns to the final figure is short (just a few mouse clicks) and easy to grasp. It contains basic stat
Category: Home & Education / Mathematics
Publisher: bram.org, License: Freeware, Price: USD $0.00, File Size: 2.0 MB
Platform: Windows
Graph constructs, visualizes and modifies graphs as well as calculates measures and layouts.
Graph constructs, visualizes and modifies graphs as well as calculates measures and layouts.
CoSBiLab Graph can construct, visualize and modify graphs as well as calculate measures and layouts. CoSBiLab Graph can import and export Data in a variety of formats, among which the reaction network generated by the beta WorkBench.
Category: Multimedia & Design / Multimedia App's
Publisher: CoSBi, License: Freeware, Price: USD $0.00, File Size: 3.1 MB
Platform: Windows
Zaitun Time Series is software designed for statistical analysis of time series data.
Zaitun Time Series is software designed for statistical analysis of time series Data. It provides easy way for time series modeling and forecasting.
Zaitun Time Series provides several statistics and neural networks models, and graphical tools that will make your work on time series analysis easier.
Statistics dan Neural Networks Analysis: Trend Analysis, Decomposition, Moving...
Category: Home & Education / Mathematics
Publisher: Zaitun Software, License: Freeware, Price: USD $0.00, File Size: 1.0 MB
Platform: Windows

The Rustemsoft UIChart control enables to create iOS apps with simple, intuitive, and visually compelling chart for complex statistical or financial analysis in different Graph types that include Pie, Bar, Line, Cylinder, Area, and other chart types. You can use the UIChart control to show graphs of a small amount of Data, or you can scale it to show charts of very large sets of...
Category: Software Development / Tools & Editors
Publisher: RustemSoft, License: Shareware, Price: USD $189.99, File Size: 3.0 MB
Platform: Windows
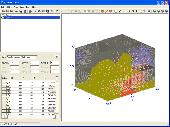
Creating graphs of regular Data and irregular Data. Creating vertex, grid and surface model, Delaunay triangles, color map, contour Plot, vector Plot, 3D contour Plot, 4D scatter, 4D slice and 4D vector.
Category: Home & Education / Science
Publisher: GraphNow, License: Shareware, Price: USD $59.95, File Size: 2.6 MB
Platform: Unknown
Operates in English (I-P) or metric (SI) units.
Operates in English (I-P) or metric (SI) units.
Create high quality, customized psychrometric charts.
Plot your process Data with state point labels.
Print a report of state points and processes.
Add notes and annotations.
Define and Plot zones on your charts, (e.g. comfort zones)
Copy/paste charts to your presentation or word processing...
Category: Multimedia & Design / Digital Media Editors
Publisher: Linric Company, License: Shareware, Price: USD $149.95, File Size: 20.2 MB
Platform: Windows
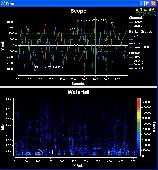
PlotLab is a set of Visual C++ components for very easy and fast Data Visualization. The library includes: Scope - scientific chart component for plotting multi-channel Data. Waterfall - Data plotting component, especially suitable for FFT results. The components allow zooming, navigation, direct printing, clipboard copy, save to file and more. All of the components...
Category: Software Development / Components & Libraries
Publisher: Mitov Software, License: Shareware, Price: USD $320.00, File Size: 181.1 MB
Platform: Windows
T&D Graph has been designed as a user friendly software which brings users even more effective tools for the management and analysis of Data recorded by T&D Data Loggers. It contains a variety of useful functions including the ability to read and merge multiple Data files and display recorded Data in Graph and/or list form.
Category: Software Development / Misc. Programming
Publisher: T&D CORPORATION, License: Freeware, Price: USD $0.00, File Size: 11.3 MB
Platform: Windows
Graph Extract is a program for digitizing plots.
Graph Extract is a program for digitizing plots. Using either manual or automated approaches, this program provides a means to easily extract numeric Data from plots. The resulting X-Y Data can be printed or replotted, or it can be saved in Excel file for
Category: Multimedia & Design
Publisher: quadtechassociates.com, License: Freeware, Price: USD $0.00, File Size: 446.0 KB
Platform: Windows
The DOP software can visualize the input from your scale and show it as a graph.
The DOP software can visualize the input from your scale and show it as a Graph. All input Data from the device are stored in the DOP and therefore it is possible to zoom in and out, store the Data on disk and to analyze the Data more carefully.
You can also print the Graph or save it as JPG and use it for documentation.
Category: Multimedia & Design / Multimedia App's
Publisher: Hauch & Bach ApS., License: Shareware, Price: USD $0.00, File Size: 457.4 KB
Platform: Windows
Create your own custom sheets of Graph paper. You have complete control over the Graph characteristics. X and Y axis can independently be set for linear or log scale. Selection from a dozen standard paper sizes, or custom create your own. Graphs saved as pdf files you can print them whenever you wish. Choose whatever color you want for the lines. Specify independent line weights...
Category: Home & Education
Publisher: Black Cat Systems, License: Shareware, Price: USD $19.99, File Size: 1.4 MB
Platform: Windows
ImageApp is a program that involves a lot of principles from machine vision.
ImageApp is a program that involves a lot of principles from machine vision. A GUI that allows you to build up an image processing Graph. An image processing Graph is essentially a sequence of algorithms that do something to images. You can imagine the Graph as the algorithms being the nodes and the flow-of-->Data between the algorithms being the arcs.
For...
Category: Multimedia & Design / Multimedia App's
Publisher: Laurence Smith, License: Shareware, Price: USD $0.00, File Size: 0
Platform: Windows
Graph Studio is the open source graph drawing/processing software.
Graph Studio is the open source Graph drawing/processing software. It allows users to build and process highly customizable graphs.
Category: Multimedia & Design
Publisher: sourceforge.net, License: Freeware, Price: USD $0.00, File Size: 118.0 KB
Platform: Windows, Mac, Vista
GraphSight Junior is an easy to use freeware handy 2D math-graphing program.
GraphSight Junior is an easy to use freeware handy 2D math-graphing program. It was originally designed to help students and teachers satisfy their day-after-day math plotting needs. It makes it easy to Plot and explore common Y(X) = F(X) Cartesian graphs, set text labels on the coordinate plane, zoom or shift a Graph with just a single click & move of mouse. The resulting...
Category: Home & Education / Miscellaneous
Publisher: CradleFields.com, License: Freeware, Price: USD $0.00, File Size: 393.0 KB
Platform: Windows
The Plot control created to display graphs and charts on .
The Plot control created to display graphs and charts on .NET Windows Forms. Advantages of this control are very quick embedding into your application and powerful features. Written using 100% managed code. Also, this control can be used to create animated graphs. With this control You can: draw lines just from arrays, use gradients to fill lines colors, draw histograms just by passing...
Category: Software Development / Components & Libraries
Publisher: Advanced Software Solutions, License: Shareware, Price: USD $19.00, File Size: 1.1 MB
Platform: Windows
PeCo-Graph is the software for the procurement and graphical visualisation of the counting Data from one or multiple PeCo range units. An easy-to-use application for PC that eases the download of the counting Data and simplifies their analysis and graphical representation.
It has multiple charts to easily make presentations, for instance, with comparisons of the...
Category: Business & Finance / Business Finance
Publisher: Visual Tools S.A., License: Freeware, Price: USD $0.00, File Size: 3.3 MB
Platform: Windows
Panoply is a Java application which enables the user to Plot raster images of geo-gridded Data from netCDF datasets. Panoply is an utility that enable user to Plot raster image. Depending on the Data, it can draw global longitude-latitude images or pole-t
Category: Multimedia & Design / Illustration
Publisher: giss.nasa.gov, License: Freeware, Price: USD $0.00, File Size: 9.4 MB
Platform: Windows, Mac, 2K, 2K3, Vista
RM Starting Graph is an easy-to-use graphing package that provides younger pupils with the ideal introduction to information handling.
This much loved software is now compatible with Windows Vista as well as having a version for Community Connect 4.
RM Starting Graph has been developed with the user in mind, and is ideal for developing initial numeracy...
Category: Home & Education / Teaching Tools
Publisher: Research Machines plc., License: Shareware, Price: USD $0.00, File Size: 0
Platform: Windows