Free Downloads: Draw Function Graph
Graph constructs, visualizes and modifies graphs as well as calculates measures and layouts.
Graph constructs, visualizes and modifies graphs as well as calculates measures and layouts.
CoSBiLab Graph can construct, visualize and modify graphs as well as calculate measures and layouts. CoSBiLab Graph can import and export data in a variety of formats, among which the reaction network generated by the beta WorkBench.
Category: Multimedia & Design / Multimedia App's
Publisher: CoSBi, License: Freeware, Price: USD $0.00, File Size: 3.1 MB
Platform: Windows
Allows you to Draw simple images on your Windows screen that appear in front of whatever programs are running. Besides just for fun, it can useful for people who are giving a presentation by projecting a computer screen for a group of people to see. The user can Draw circles, arrows, or other symbols on the screen to emphasize or clarify the text or diagrams on the screen....
Category: Audio / Music Management
Publisher: Leithauser Research, License: Shareware, Price: USD $14.98, File Size: 471.0 KB
Platform: Windows
Complex Grapher is a graphing calculator to create a Graph of complex Function. 3D Function graphs and 2D color maps can be created with this grapher. You can input complex functions in the form of w=f(z) (where z=x+yi) directly before creacting graphs. Graphs can be copied and saved in the format of bitmap.Complex Grapher is a graphing calculator to create a Graph...
Category: Home & Education
Publisher: GraphNow, License: Shareware, Price: USD $19.95, File Size: 976.6 KB
Platform: Windows
Visual Calculus is a grapher to compute and Graph limit, derivative, integral, 3D vector, partial derivative Function, series, ODE etc.Pre-calculus: functions, piecewise defined Function, even and odd functions, polynomials, rational functions.The program has the Ability to set and modify the properties of coordinate graphs, animations and table graphs.Also the ability to...
Category: Home & Education / Mathematics
Publisher: GraphNow Software, License: Shareware, Price: USD $60.00, File Size: 3.4 MB
Platform: Windows
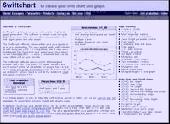
Chart java applet software to generate dynamic charts and graphs within JSP, servlets or java applications - bar, line, pie, stacked and grouped charts in 2D and 3D with a wide range of parameters and chart types. Main features: Charts in 2D/3D, Anti aliasing, Multi language support, Cross browser compatible, Java Script parameter control, Data labels, Contextual data drill down, CSV data...
Category: Software Development
Publisher: Swiftchart Limited, License: Demo, Price: USD $99.00, File Size: 97.7 KB
Platform: Windows, Mac, Linux, Unix, MS-DOS, AS/400
Chart java applet software to generate dynamic charts and graphs within JSP, servlets or java applications - bar, line, pie, stacked and grouped charts in 2D and 3D with a wide range of parameters and chart types. Main features: Charts in 2D/3D, Anti aliasing, Multi language support, Cross browser compatible, Java Script parameter control, Data labels, Contextual data drill down, CSV data...
Category: Software Development / Tools & Editors
Publisher: Swiftchart Limited, License: Demo, Price: USD $99.00, File Size: 97.0 KB
Platform: Windows, Mac, Linux, Unix, MS-DOS, AS, 400
DataPlot is a program where you can import your time based data and graph it.
DataPlot is a program where you can import your time based data and Graph it.You can move easily back and forward in user defined time window, allows individual time setting for each Graph, values read directly in Graph by dragging mouse over the curve and much more
Category: Multimedia & Design / Multimedia App's
Publisher: CBIM, License: Freeware, Price: USD $0.00, File Size: 311.0 KB
Platform: Windows
Drawing graphs without the right tool is simply difficult.
Drawing graphs without the right tool is simply difficult. uDraw(Graph) automates this task for you. Find out how uDraw(Graph) creates your flow charts, diagrams, hierarchies or structure visualizations using automatic layout - much faster than with any standard drawing program. With the API, uDraw(Graph) can even be embedded in your own programs as a visualization component.
Category: Multimedia & Design / Image Editing
Publisher: University Bremen, FB3, Germany, License: Freeware, Price: USD $0.00, File Size: 2.6 MB
Platform: Windows
Math tool for high school teachers and students. Function graphing and analyzing: 2D, 2.5D Function graphs and animations, extrema, root, tangent, limit,derivative, integral, inverse; sequence of number: arithmetic progression, geometric progression; analytic geometry: vector, line, circle, ellipse, hyperbola and parabola; solid geometry: spatial line, prism, pyramid, cylinder,...
Category: Home & Education / Mathematics
Publisher: GraphNow, License: Shareware, Price: USD $29.95, File Size: 2.3 MB
Platform: Unknown
STFMath, technically enhanced math utility, allows you to: Draw Cartesian (standard or parametric) and Polar functions, special functions (Gamma,Beta,Fourier, Blancmange) or Integral (with Average preview) in MDI (Multi Documents Interface) supported Graph Mode (open up to 10 independent Graph documents in the same window).
Category: Home & Education / Mathematics
Publisher: Slavko Ilic, License: Shareware, Price: USD $24.00, File Size: 4.2 MB
Platform: Unknown
The first free tool for Windows able to draw multi-level pie charts of disk space.
The first free tool for Windows able to Draw multi-level pie charts of disk space. HDGraph displays graphically the hard disk space usage. It shows all your directories and subdirectories on a single Graph, allowing to see the largest ones at a glance.
Category: Utilities / File & Disk Management
Publisher: hdgraph.objectis.net, License: Freeware, Price: USD $0.00, File Size: 2.4 MB
Platform: Windows, Vista
Bouncy Draw is an entertaining funny game.
Bouncy Draw is an entertaining funny game. You will like it from the first time you play! Play Bouncy Draw Game and Draw lines to propel the raccoon up in the air within the canyon, watch out for vultures and tree branches, there is a spiky dragon waiting at the bottom so watch out. Use mouse. Click on your raccoon to start bouncing and Draw lines for him to bounce...
Category: Games / Misc. Games
Publisher: freeworldgroup, License: Freeware, Price: USD $0.00, File Size: 931.8 KB
Platform: Windows
Enhanced programmable calculator
The most easy and complet programmable RPN calculator in Internet. Compare it with any other you can find! It will accept arithmetic expressions or functions: for example to compute the expression (1+a^2)*((a-1)/(a+1) you have to insert (or paste from clipboard) the expression as it's written, insert a value for a and press 'enter'. Graph plotting of a Function - Computing of...
Category: Home & Education / Mathematics
Publisher: Lis Schmitz & Mario Cazorzi, License: Shareware, Price: USD $35.00, File Size: 2.5 KB
Platform: Unknown
ImageApp is a program that involves a lot of principles from machine vision.
ImageApp is a program that involves a lot of principles from machine vision. A GUI that allows you to build up an image processing Graph. An image processing Graph is essentially a sequence of algorithms that do something to images. You can imagine the Graph as the algorithms being the nodes and the flow-of-->data between the algorithms being the arcs.
For...
Category: Multimedia & Design / Multimedia App's
Publisher: Laurence Smith, License: Shareware, Price: USD $0.00, File Size: 0
Platform: Windows
My Diet Diary is a program you install on your PC, it helps you track your weight lose and calorie intake. Very simple and easy to use yet draws very informative charts and graphs to show how you are doing.
Features:
Very simple to set up and use, once installed it will take you minutes to be up and running
Track your weight by entering your regular weigh in, the program will...
Category: Home & Education / Health & Nutrition
Publisher: Julie Stone, License: Freeware, Price: USD $0.00, File Size: 1024 B
Platform: Windows
The WebViewer plug-in enables Windows users whether or not they have SigmaPlot to explore the data used to create the Graph.
Using the WebViewer plug-in with your Web browser window you can:
- View the data used to create the Graph
- Print a Graph in a web document at full resolution
- Zoom in and out of a Graph
- Grab and...
Category: Multimedia & Design / Graphics Viewers
Publisher: SYSTAT Software Inc., License: Freeware, Price: USD $0.00, File Size: 12.6 MB
Platform: Windows
With The Option Strategy Builder you could pick up an option and place it directly to the return Graph. As with the online tool, just drag and drop the option on the Graph, and build your strategy. Using your mouse, the options can be easily moved on the Graph to different strike prices, and to different expiration dates.
With this program you can manage your...
Category: Multimedia & Design / Multimedia App's
Publisher: SamoaSky, License: Freeware, Price: USD $0.00, File Size: 3.1 MB
Platform: Windows
Excel Graph Multiple Equations Software is an application that allows you to plot multiple functions in Microsoft Excel. It is able to create multiple charts based on the formulas entered. You can enter an equation manually or load multiple equations from a text file (.txt). The application is able to plot each equation on an individual Graph or all the equations on a single...
Category: Business & Finance / MS Office Addons
Publisher: Sobolsoft, License: Shareware, Price: USD $19.99, File Size: 2.5 MB
Platform: Windows
Statistical analysis and report-ready chart.
LeoReport is a software application for generating inspired report-ready graphic presentation of statistical analysis of diversity of data. It's fast, portable, user-friendly with intuitive interface. LeoReport can create: a histogram of variable distribution with comparison Student and Poisson probability functions; two arguments distribution with 3D and color map presentation; curve fitting...
Category: Home & Education / Mathematics
Publisher: Leonid Sakharov, License: Shareware, Price: USD $99.95, File Size: 490.0 KB
Platform: Unknown
The Library GraphDiag is intended for building Graph and diagrams on HBITMAP, surface DirectDraw and in file BMP format. The Library can build the graphs on entered text line and diagrams, as from tables, which format is provided by developer, so and from files HTML-format and from XLS files Excel. Given version first and is not deprived defect and restrictions. The Restrictions are of...
Category: Software Development / Components & Libraries
Publisher: Kruchinin Aleksandr, License: Freeware, Price: USD $0.00, File Size: 67.0 KB
Platform: Windows
Graph-A-Ping allows you to visually see the ping latency between ping times.
Graph-A-Ping allows you to visually see the ping latency between ping times. The bigger the gap between one ping to another allows you to spot possible network bottle neck.
This tool is actually an applet part of Glass Net Networks monitoring console.
Category: Internet / Misc. Plugins
Publisher: Mataluis.Com, License: Freeware, Price: USD $0.00, File Size: 2.1 MB
Platform: Windows
LAB Fit is a software for Windows developed for treatment and analysis of experimental data.
LAB Fit is a software for Windows developed for treatment and analysis of experimental data. At LABFit program you are able to:
1) Treat similar data (grouped and ungrouped dataset, one or two samples);
2) Treat non-similar data;
3) Determine propagated error (error propagation up to eight independent variables);
4) Plot 2D and 3D Graph (normal, parametric, imported...
Category: Home & Education / Science
Publisher: Wilton Pereira da Silva, License: Shareware, Price: USD $60.00, File Size: 3.3 MB
Platform: Windows
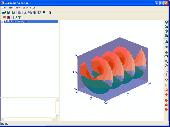
XYZ Data Viewer is a Excel table to 3-D graph converter.
XYZ Data Viewer is a Excel table to 3-D Graph converter. It provide easy way to analyze a variety of tabular data from Microsoft Excel in the view of 3-dimensions Graph. With this tool You can view and examine your data as a three-dimensional object in three-dimensional space, by manipulate the 3d object on the program screen. You can save this 3d Graph as a file and upload...
Category: Multimedia & Design / Media Management
Publisher: 3 Fish Software, License: Shareware, Price: USD $69.95, File Size: 9.1 MB
Platform: Windows
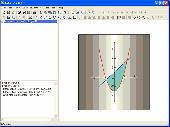
FX Draw is a mathematically aware drawing surface that understands what it is that you are trying to produce and provides you with tools specifically designed to make your job easier. No matter what you need to Draw, FX Draw is likely to have a tool devoted to the task. FX Draw is an essential tool for any mathematics teacher's toolbox.
Category: Home & Education / Mathematics
Publisher: Efofex Software, License: Shareware, Price: USD $136.70, File Size: 12.6 MB
Platform: Windows
Chart Library for .NET is a chart library that gives the software developer a comprehensive way to create and/or save charts their software application. To create any Chart you can use two constructors: CChart(int width,int height) - where width – the chart width and height – the chart height; Draw(Graphics Graph) – where Graph – the graphics...
Category: Multimedia & Design / Multimedia App's
Publisher: Sparrow Technologies, Inc, License: Shareware, Price: USD $129.00, File Size: 505.1 KB
Platform: Windows