Free Downloads: Drawing Ng Bar Graph
SBHistogram generates simple histograms from simple ASCII data files.
SBHistogram generates simple histograms from simple ASCII data files. It's a simple tool designed to be easy to use.
A histogram is a chart in which data values in counted and placed into buckets. For example, let's assume you want to do a histogram of peoples ages. Then you might want to use buckets such as 1-10 years, 11-20 years, 21-30 years, etc. Each bucket counts the...
Category: Multimedia & Design / Multimedia App's
Publisher: SB-Software, License: Freeware, Price: USD $0.00, File Size: 604.0 KB
Platform: Windows
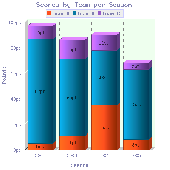
This PHP script provides a very easy way to embed dynamically generated stacked vertical Bar graphs and charts into PHP applications and HTML web pages. The graphing software is very easy to use and it's perfectly possible to add professional quality real time graphing to web pages and applications within minutes. With a free trial and Money Back Guarantee, try it out today.
Category: Software Development
Publisher: Sirius Computer Consultants Limited, License: Shareware, Price: USD $49.00, File Size: 122.9 KB
Platform: Windows, Mac, Linux, OS/2, Unix

This PHP script provides a very easy way to embed dynamically generated stacked horizontal Bar graphs and charts into PHP applications and HTML web pages. The graphing software is very easy to use and it's perfectly possible to add professional quality real time graphing to web pages and applications within minutes. With a free trial and Money Back Guarantee, try it out today.
Category: Audio
Publisher: Sirius Computer Consultants Limited, License: Shareware, Price: USD $49.00, File Size: 122.6 KB
Platform: Windows, Mac, Linux, OS/2, Unix
 Shareware
Tabbed viewing, editing, and managing multiple Visio files in single Window: Tabs for Visio (is also named Visio Tab). Once the software is installed, you can find a tab Bar in Microsoft Visio as in Internet Explorer 8 and FireFox. When you open or create a Drawing file, there will be a corresponding tab in the tab Bar. You can switch among Drawing files just by...
Category: Business & Finance / Business Finance
Publisher: Detong Technology Ltd., License: Shareware, Price: USD $29.99, EUR23.5, File Size: 12.1 MB
Platform: Windows
Insight Graphing allows you to add graphs to your Clarion Windows, or Reports.
Insight Graphing allows you to add graphs to your Clarion Windows, or Reports. But more importantly than just the ability, it also provides a powerful template interface which allows you to Graph data directly out of your files, queues or memory. It also features complete control over the look of your Graph, from the axis settings, to the Graph itself, even the legend. You...
Category: Multimedia & Design / Multimedia App's
Publisher: Capesoft, License: Shareware, Price: USD $349.00, File Size: 968.0 KB
Platform: Windows
Grapher is the ultimate technical graphing package available.
Grapher is the ultimate technical graphing package available.
Choose from several specialty Graph types, including ternary, box-whisker, bubble plots, pie charts, and hi-low-close plots.
Wow your audience every time they see your graphs. Create one of 54 unique Graph types.
This easy-to-use, powerful, dynamic program will help you create...
Category: Multimedia & Design / Multimedia App's
Publisher: Golden Software, License: Shareware, Price: USD $0.00, File Size: 34.0 MB
Platform: Windows
Graph constructs, visualizes and modifies graphs as well as calculates measures and layouts.
Graph constructs, visualizes and modifies graphs as well as calculates measures and layouts.
CoSBiLab Graph can construct, visualize and modify graphs as well as calculate measures and layouts. CoSBiLab Graph can import and export data in a variety of formats, among which the reaction network generated by the beta WorkBench.
Category: Multimedia & Design / Multimedia App's
Publisher: CoSBi, License: Freeware, Price: USD $0.00, File Size: 3.1 MB
Platform: Windows
DRPRO (Drawing Register Professional) is a computerized Drawing & Document Management System for use in a Drawing office environment. It is designed to do the tedious work of maintaining an accurate Drawing and document issue register in a multi-disciplinary Engineering, Architectural or Interior Design practice, or virtually any Drawing office.
Category: Multimedia & Design / Image Editing
Publisher: LDA Computing, License: Shareware, Price: USD $0.00, File Size: 0
Platform: Windows
Chemistry 4-D Draw is a next-generation chemistry program combining the most advanced technologies in structure Drawing.
Chem4D Graph module that creates multi-line graphs of different styles. It supports non-linear and linear curve fitting, response curve fitting and data analysis.
The program allows you to create high-quality structures simply by entering molecular...
Category: Home & Education / Science
Publisher: ChemInnovation Software, Inc., License: Shareware, Price: USD $149.00, File Size: 1.8 MB
Platform: Windows
NOV Diagram for .NET is built upon the NOV Document Object Model (DOM) and is a scalable and extensible solution. It has been carefully designed to meet a vast amount of customization requests. The object model and the API had been thoroughly refined to be as native and intuitive as possible. NOV Diagram for .NET features: Drawings: Drawings are constructed by multiple pages each of which...
Category: Software Development / Components & Libraries
Publisher: Nevron Software LLC, License: Shareware, Price: USD $949.00, File Size: 184.6 MB
Platform: Windows
DataPlot is a program where you can import your time based data and graph it.
DataPlot is a program where you can import your time based data and Graph it.You can move easily back and forward in user defined time window, allows individual time setting for each Graph, values read directly in Graph by dragging mouse over the curve and much more
Category: Multimedia & Design / Multimedia App's
Publisher: CBIM, License: Freeware, Price: USD $0.00, File Size: 311.0 KB
Platform: Windows
Demo
This COM object / ASP component draws pie and Bar charts and line graphs on the fly. Output can be streamed to the browser using BinaryWrite, or saved to file. Image types include GIF, PNG, JPG and bitmap. A wide range of properties allow the customisation of colour, size and text style. Built in defaults allow the production of graphs with only a few lines of code. Show percentages or...
Category: Web Authoring / Scripts & CGI Tools
Publisher: Chestysoft, License: Demo, Price: USD $60.00, File Size: 594.9 KB
Platform: Windows
Make Professional Website Voting Polls Quickly and Easily.
Make Professional Website Voting Polls Quickly and Easily. Preview while you work. WYSIWYG design. Several customizable features including background images, background colors, border, fonts, size, and more. Unlimited Bar Graph colors. Show or hide Bar Graph and number of votes. View voting results instantly online. Prevent duplicate votes by checking IP addresses....
Category: Web Authoring / Web Design Utilities
Publisher: Oven Fresh Web Design, License: Shareware, Price: USD $27.95, File Size: 5.3 MB
Platform: Windows
This ASP.NET component draws pie and Bar charts and line graphs "on the fly". Output can be streamed to the browser in GIF or other formats, saved to file or exported to a Bitmap structure. A wide range of properties allow the customisation of colour, size and text style. Built in defaults allow the production of graphs with only a few lines of code. Show percentages or actual values....
Category: Software Development
Publisher: Chestysoft, License: Demo, Price: USD $60.00, File Size: 579.5 KB
Platform: Windows
JFDraw is a pure Java based graphics application and library package. JFDraw used a little features of Java2D, and expanded a lot of Graph routines for more complex vector Graph processing. You can run JFDraw under any operating systems that suport Java. JFDraw is focused on vector Graph Drawing field. It can help you to complete your mechanical, electronic,...
Category: Multimedia & Design
Publisher: JingFei International, License: Freeware, Price: USD $0.00, File Size: 516.6 KB
Platform: Windows, Mac, Linux, Unix, OS/2
-- VFWH Monitor has the ability to calculate and Graph all the network traffic between local machine and any other machines. -- Main features of VFWH Monitor:Calculate statistics for bound Interfaces.Calculate statistics for chosen Connections.Calculate using time for Interfaces and Connections.Graph real-time diagram for Interfaces traffic....and more, more, more. Just explore...
Category: Utilities / System Utilities
Publisher: Cyber Complete Systems, License: Shareware, Price: USD $35.00, File Size: 634.9 KB
Platform: Windows
yFiles FLEX makes it easy to integrate sophisticated Graph visualization and editing functionality into a rich Internet application based on Adobe® Flex® or AIR™. The framework provides a full-featured Flex UI component for viewing and editing diagrams along with a comprehensive Graph Drawing and editing class library.
Category: Multimedia & Design / Image Editing
Publisher: yWorks GmbH, License: Demo, Price: USD $0.00, File Size: 122.5 MB
Platform: Windows
ImageApp is a program that involves a lot of principles from machine vision.
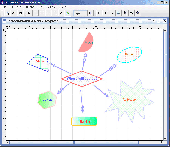
ImageApp is a program that involves a lot of principles from machine vision. A GUI that allows you to build up an image processing Graph. An image processing Graph is essentially a sequence of algorithms that do something to images. You can imagine the Graph as the algorithms being the nodes and the flow-of-->data between the algorithms being the arcs.
For...
Category: Multimedia & Design / Multimedia App's
Publisher: Laurence Smith, License: Shareware, Price: USD $0.00, File Size: 0
Platform: Windows
The WebViewer plug-in enables Windows users whether or not they have SigmaPlot to explore the data used to create the Graph.
Using the WebViewer plug-in with your Web browser window you can:
- View the data used to create the Graph
- Print a Graph in a web document at full resolution
- Zoom in and out of a Graph
- Grab and...
Category: Multimedia & Design / Graphics Viewers
Publisher: SYSTAT Software Inc., License: Freeware, Price: USD $0.00, File Size: 12.6 MB
Platform: Windows
Tools soft collection contains menu applets with fade effect, slide menus, tree menus,and dropdown menus, and also charting and Graph applets (pie and Bar styles).Presentation applets like head scroll, newsticker, and fade ticker applets.
Category: Web Authoring / Reference & Tutorials
Publisher: Tools Soft Solutions, License: Shareware, Price: USD $9.00, File Size: 55.0 KB
Platform: Windows, Linux,
Fotoview Graphing is an easy to use program for Drawing and exploring graphs of mathematical functions and their derivatives. Functions can be entered by typing on the keyboard or by pressing the function buttons on the screen with the mouse. You can zoom in and out and move the Graph around in a flexible way. You can also open, save and print the graphs and functions.
...
Category: Multimedia & Design / Multimedia App's
Publisher: Fotoview, License: Shareware, Price: USD $0.00, File Size: 6.3 MB
Platform: Windows
Make Website Voting Polls Quickly and Easily.
Make Website Voting Polls Quickly and Easily. Preview while you work. WYSIWYG design. Lots of customizable features including background images, background colors, header images, border, button, cursor, fonts, size, and more. Unlimited Bar Graph colors. Show or hide Bar Graph. Show or hide number of votes. View voting results instantly online. Prevent duplicate votes...
Category: Web Authoring / Web Design Utilities
Publisher: Oven Fresh Web Design, License: Shareware, Price: USD $27.95, File Size: 5.3 MB
Platform: Windows
With The Option Strategy Builder you could pick up an option and place it directly to the return Graph. As with the online tool, just drag and drop the option on the Graph, and build your strategy. Using your mouse, the options can be easily moved on the Graph to different strike prices, and to different expiration dates.
With this program you can manage your...
Category: Multimedia & Design / Multimedia App's
Publisher: SamoaSky, License: Freeware, Price: USD $0.00, File Size: 3.1 MB
Platform: Windows

Audio Graph ActiveX is an ActiveX (OCX) component for software developers. With this ActiveX component you can display a meter, detect a silence, and display 2 types of audio graphs by the WaveIn/WaveOut buffers. Just send a pointer of the buffers array to the component then operate the Display function, the component will do the rest on the Graph view. You can set the...
Category: Software Development
Publisher: expresslib.com, License: Shareware, Price: USD $69.00, File Size: 806.5 KB
Platform: Windows
Excel Graph Multiple Equations Software is an application that allows you to plot multiple functions in Microsoft Excel. It is able to create multiple charts based on the formulas entered. You can enter an equation manually or load multiple equations from a text file (.txt). The application is able to plot each equation on an individual Graph or all the equations on a single...
Category: Business & Finance / MS Office Addons
Publisher: Sobolsoft, License: Shareware, Price: USD $19.99, File Size: 2.5 MB
Platform: Windows