Free Downloads: Excel Volatility Chart
This is a free spreadsheet that downloads free historical stock data from the Yahoo database and calculates the historical (realized) Volatility of the selected stock. The standard deviation of prices are plotted along side the stock price Chart.
Category: Business & Finance / Business Finance
Publisher: optiontradingtips.com, License: Freeware, Price: USD $0.00, File Size: 70.3 KB
Platform: Windows, Mac, 2K, 2K3, Vista
We have invested 3 years into developing our Excel Gantt Chart templates incorporating the requirements of hundreds of customers. Whilst our solutions look simple and are easy to use, they are the most powerful, professional Gantt Chart templates available.
After years in senior Project Management roles, the founder of Chart Gantt, Marcus Tarrant, found that...
Category: Business & Finance / Project Management
Publisher: Chartgantt.com, License: Freeware, Price: USD $0.00, File Size: 466.0 KB
Platform: Windows, Mac
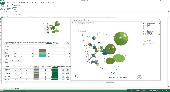
Create stunning 3D bubble charts in Excel with 5dchart Add-In! 5dchart Add-In for Microsoft Excel is an easy-to-use tool for multi-dimensional data visualization. It allows you to display a 3D bubble Chart with two additional parameters: 3D coordinates of each bubble and bubble size and colour. Of course, it is the easy way to create 3D scatter plot too. 5dchart Add-In is...
Category: Business & Finance / MS Office Addons
Publisher: System Approach Ltd., License: Shareware, Price: USD $99.90, File Size: 809.0 KB
Platform: Windows
A very commonly requested Excel feature is the ability to add labels to XY chart data points.
A very commonly requested Excel feature is the ability to add labels to XY Chart data points. The XY Chart Labeler adds this feature to Excel. The XY Chart Labeler provides the following options:
- Add XY Chart Labels - Adds labels to the points on your XY Chart data series based on any range of cells in the workbook.
- Move XY...
Category: Business & Finance / MS Office Addons
Publisher: Application Professionals, License: Freeware, Price: USD $0.00, File Size: 1.2 MB
Platform: Windows
The Tradingbasis Tools for Amibroker are designed to improve your trading performance significantly and to make it much easier than ever before to find profitable trading patterns. You can find your favorite patterns with just a few mouse clicks. Every market and every time frame can be used. It shows up signals automatically. Some features are: Scanning for Chart formations like trend...
Category: Business & Finance / Business Finance
Publisher: Tradingbasis, License: Commercial, Price: USD $0.00, File Size: 1.9 MB
Platform: Windows
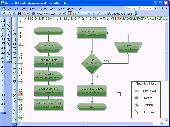
FlowBreeze Flow Chart Add-In for Microsoft Excel ... the Fastest, Easiest Way to Create Professional Looking Flow Charts. ... Make flowcharts just by typing text - FlowBreeze automatically does the rest ... It generates the flow Chart symbols for you, based on the words you use ... It automatically applies the formatting you choose, adds flow lines, and aligns the flow...
Category: Business & Finance
Publisher: BreezeTree Software, LLC, License: Shareware, Price: USD $39.95, File Size: 2 B
Platform: Windows
The Gantt Chart Builder System provides a system to build professional quality Gantt charts without the need for Microsoft Project or similar products.Charts can be constructed with either Microsoft Excel or Access. This version is the Excel version. Quite often, your data is present in a database and the production of such charts has been extremely difficult without...
Category: Business & Finance / Project Management
Publisher: Bandwood Pty Limited, License: Demo, Price: USD $69.95, File Size: 6.9 MB
Platform: Windows
Option Calculator - free tool for calculating option price, implied volatility and option greeks.
Option Calculator - free tool for calculating option price, implied Volatility and option greeks. You can: calculate the value of put and call options (The Black-Scholes Option Pricing Model), calculate implied Volatility, calculate greeks (Delta, Vega, G
Category: Business & Finance / Business Finance
Publisher: trader-soft.com, License: Freeware, Price: USD $0.00, File Size: 450.0 KB
Platform: Windows, Mac, 2K
Stock Options Online Indicators.
Stock Options Online Indicators. Implied Volatility, Covered Call Rate, Delta and much more.
Category: Business & Finance / Business Finance
Publisher: optionstradedata.com, License: Freeware, Price: USD $0.00, File Size: 279.0 KB
Platform: Windows, Mac, 2K, 2K3, Vista
PatternExplorer for Amibroker is designed to improve your trading performance significantly and to make it much easier than ever before to find profitable trading patterns. You can find your favorite patterns with just a few mouse clicks and in a matter of minutes. Every market and every time frame can be used. It shows up signals automatically. Some features are: Scanning for Chart...
Category: Business & Finance
Publisher: PatternExplorer, License: Commercial, Price: USD $199.00, File Size: 2.8 MB
Platform: Windows
 Shareware
Used by HR professionals world-wide. OrgChart Professional can help you automate your organization charts so you can keep pace with re-organizations and frequent personnel changes. With our organization Chart software, you can create org charts in minutes, track key employee information such as appraisals, contact information, job descriptions, etc. Our org Chart software powerful...
Category: Business & Finance / Small Business Tools
Publisher: Officework Software, License: Shareware, Price: USD $59.95, File Size: 40.2 MB
Platform: Windows
The Gantt Chart Builder System provides a system to build professional quality Gantt charts without the need for Microsoft Project or similar products.Charts can be constructed with either Microsoft Excel or Access. This version is the Access version. Quite often, your data is present in a database and the production of such charts has been extremely difficult without expensive...
Category: Business & Finance / Project Management
Publisher: Bandwood Pty Limited, License: Demo, Price: USD $59.95, File Size: 4.9 MB
Platform: Windows
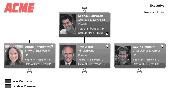
Used by HR professionals world-wide to automate organization Chart creation and updates, OrgChart Pro is an easy-to-use and comprehensive organizational charting application. OrgChart Professional can help you automate your organization charts so you can keep pace with re-organizations and frequent personnel changes. With our organization Chart software, you can create org charts...
Category: Business & Finance / Business Finance
Publisher: Officework Software, License: Demo, Price: USD $195.00, File Size: 38.1 MB
Platform: Windows
Shareware
Ashkon Stock Watch is an advanced charting software for financial market information. Unlike a conventional financial website it allows to display several technical indicators for a single security on the same Chart, open multiple Chart documents, maintain predefined lists of securities and test your own investment strategies. Ashkon Stock Watch has several built in market...
Category: Business & Finance / Business Finance
Publisher: Ashkon Technology LLC, License: Shareware, Price: USD $95.00, File Size: 3.4 MB
Platform: Windows, Other
Hard Drive Pie Chart Software is a small utility that allows you to compare the size of folders with one another. The application has a simple interface where all you need to do is choose the drive you want to examine. Output is produced in an easy-to-read pie Chart that can be exported as JPG, Excel, or text file.
Category: Utilities / Misc. Utilities
Publisher: Sobolsoft, License: Shareware, Price: USD $19.99, File Size: 2.8 MB
Platform: Windows
This program can help when you need to organize a production schedule.
This program can help when you need to organize a production schedule. Enter categories of tasks to form broad divisions of labor, enter tasks to subdivide categories, and enter project begin and end dates as special events. A custom Gantt Chart is automatically generated and ready for tracking with Excel or with a printed copy.
Category: Business & Finance / MS Office Addons
Publisher: Sobolsoft, License: Shareware, Price: USD $19.99, File Size: 2.5 MB
Platform: Windows
Excel Automated Grader is an automated grader/marker for use by instructors in Microsoft Excel and Microsoft Office application courses. Excel Grader performs static analysis on Microsoft Excel workbooks. The program compares a student workbook with the instructor's correct version of the workbook. The student workbook is marked and a grade report is embedded....
Category: Home & Education
Publisher: OfficeGrader.com, License: Shareware, Price: USD $69.95, File Size: 860.2 KB
Platform: Windows
Chart Trainer -Learn to read nautical charts like an expert.
Chart Trainer -Learn to read nautical charts like an expert.
Chart Trainer is designed to help mariners interpret nautical charts and use them more efficiently, both traditional paper charts and new digital charts for computers. The materials cover all aspects of nautical charts in the most detail available, including tutorials on Chart reading and plotting, along...
Category: Home & Education / Teaching Tools
Publisher: Starpath School of Navigation, License: Shareware, Price: USD $39.00, File Size: 39.8 MB
Platform: Windows
KaotiXL is an add in use to do a rescaled range analysis with MS Excel.
KaotiXL is an add in use to do a rescaled range analysis with MS Excel. User will learn how easy it is to use a worksheet as a powerful forecasting tool. It also generate a report with all the calculated values shown and 2 graph are built. The R/S Chart and V statistic Chart. Hurst exponent is also calculated and shown in this report. Charting in this program will make it...
Category: Business & Finance / Personal Finance
Publisher: XLPert Enterprise, License: Shareware, Price: USD $15.00, File Size: 85.0 KB
Platform: Windows
Shareware
SpreadsheetConverter is an add-on to Microsoft Excel that converts your spreadsheet to a good-looking live web page. Upload the web page to your website and your spreadsheet is immediately available on the web. Add a Send button and test-drive the free form-to-Inbox service - it's so easy! With SpreadsheetConverter, anyone can create a calculating order form that can be...
Category: Business & Finance / Spreadsheets
Publisher: Framtidsforum I&M AB, License: Shareware, Price: USD $97.00, File Size: 8.4 MB
Platform: Windows
KG-Chart for Cross Stitch" is a program to design a chart for cross stitching.
KG-Chart for Cross Stitch" is a program to design a Chart for cross stitching.
The ability to draw each stitch with a color and mark makes it easier for users to create a pattern for cross stitching. Usual painting software can't do this.
With this program you can print a Chart and a color table in which pages are automatically divided.
It also...
Category: Software Development / Help File Utilities
Publisher: Mozusystems, LLC, License: Shareware, Price: USD $0.00, File Size: 1.2 MB
Platform: Windows
Shareware
FlexCell is a flexible and easy to use grid control. Using FlexCell Grid Control, you can create the professional user interfaces and report form in your application. FlexCell Grid Control provides comprehensive functions such as Print, Print Preview, Chart, Merge Cell, Virtual Grid, Sort, Import (from) and Export (to) XML, Export to Excel Workbook (no need of Excel...
Category: Software Development
Publisher: FlexCell Technologies, License: Shareware, Price: USD $129.00, File Size: 2.4 MB
Platform: Windows
We are delighted to present you with the new FlatTrader, a software that was built for trading a multitude of CFD derivatives and spot Forex transactions. Within the platform, the markets are analyzed and are available in real time.The new FlatTrader has been developed on basis of a stable, reliable and well-proven infrastructure that allows our customers to trade in CFDs and Forex by passing...
Category: Business & Finance / Business Finance
Publisher: FX Flat, License: Demo, Price: USD $0.00, File Size: 25.7 MB
Platform: Windows
Java Chart Designer is a powerful charting Java application that empowers you with all necessary tools to create charts for professionally looking presentations, business and scientific reports that can be easily integrated into website as Java applet, Java applications or saved as JPEG images. A user-friendly interface, great number of visual effects and predefined Chart types,...
Category: Business & Finance
Publisher: ELTIMA Software GmbH, License: Shareware, Price: USD $99.95, File Size: 2.8 MB
Platform: Windows
KG-Chart for Cross Stitch" is a program to design a chart for cross stitching.
KG-Chart for Cross Stitch" is a program to design a Chart for cross stitching. This program has following features:
* Drawing pixels with mark to distinguish color.
* Color palette (mimic DMC's thread color).
* Drawing backstitching
* Print/Preview/Real view of a Chart.
* Import/Export a Chart to/from other image...
Category: Multimedia & Design / Multimedia App's
Publisher: Keiji Ikuta Software Laboratory, License: Freeware, Price: USD $0.00, File Size: 1.1 MB
Platform: Windows