Free Downloads: Extension Code Graph Prism

Chart java applet software to generate dynamic charts and graphs - bar, line, pie, stacked and grouped charts in 2D and 3D with a wide range of parameters and chart types. Main features: Charts in 2D/3D, Anti aliasing, Multi language support, Cross browser compatible, Java Script parameter control, Data labels, Contextual data drill down, CSV data sources, Trend calculation, 3D depth control,...
Category: Multimedia & Design
Publisher: Swiftchart Limited, License: Demo, Price: USD $99.00, File Size: 97.7 KB
Platform: Windows, Mac, Linux, Unix, MS-DOS, AS/400
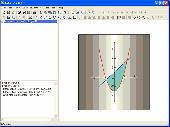
Math tool for high school teachers and students. Function graphing and analyzing: 2D, 2.5D function graphs and animations, extrema, root, tangent, limit,derivative, integral, inverse; sequence of number: arithmetic progression, geometric progression; analytic geometry: vector, line, circle, ellipse, hyperbola and parabola; solid geometry: spatial line, Prism, pyramid, cylinder, cone,...
Category: Home & Education / Mathematics
Publisher: GraphNow, License: Shareware, Price: USD $29.95, File Size: 2.3 MB
Platform: Unknown
iSense Prism. BI Evolved.
Do-it-yourself BI – from mountains of raw data to reports, dashboards and analytics in a single product.
Traditionally, the delivery of high-end business intelligence (BI) depended on large, complex software and IT staff with specialized skills. These business intelligence systems, still in wide use today, require extensive data...
Category: Business & Finance / Database Management
Publisher: SiSense, License: Shareware, Price: USD $0.00, File Size: 0
Platform: Windows
Graph constructs, visualizes and modifies graphs as well as calculates measures and layouts.
Graph constructs, visualizes and modifies graphs as well as calculates measures and layouts.
CoSBiLab Graph can construct, visualize and modify graphs as well as calculate measures and layouts. CoSBiLab Graph can import and export data in a variety of formats, among which the reaction network generated by the beta WorkBench.
Category: Multimedia & Design / Multimedia App's
Publisher: CoSBi, License: Freeware, Price: USD $0.00, File Size: 3.1 MB
Platform: Windows
Extension Changer integrates with windows explorer and display the Extension without opening the main window.
Extension Changer is skinnable, two default skins are included in the installation file. You can also create your own skin with little effort.
Change the Extension of many files with one click, Extension Change can apply the...
Category: Utilities / File & Disk Management
Publisher: CairoCubicles, License: Freeware, Price: USD $0.00, File Size: 355.0 KB
Platform: Windows

Chart java applet software to generate dynamic charts and graphs within JSP, servlets or java applications - bar, line, pie, stacked and grouped charts in 2D and 3D with a wide range of parameters and chart types. Main features: Charts in 2D/3D, Anti aliasing, Multi language support, Cross browser compatible, Java Script parameter control, Data labels, Contextual data drill down, CSV data...
Category: Software Development
Publisher: Swiftchart Limited, License: Demo, Price: USD $99.00, File Size: 97.7 KB
Platform: Windows, Mac, Linux, Unix, MS-DOS, AS/400
Chart java applet software to generate dynamic charts and graphs within JSP, servlets or java applications - bar, line, pie, stacked and grouped charts in 2D and 3D with a wide range of parameters and chart types. Main features: Charts in 2D/3D, Anti aliasing, Multi language support, Cross browser compatible, Java Script parameter control, Data labels, Contextual data drill down, CSV data...
Category: Software Development / Tools & Editors
Publisher: Swiftchart Limited, License: Demo, Price: USD $99.00, File Size: 97.0 KB
Platform: Windows, Mac, Linux, Unix, MS-DOS, AS, 400
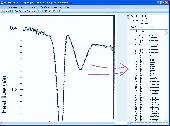
DataPlot is a program where you can import your time based data and graph it.
DataPlot is a program where you can import your time based data and Graph it.You can move easily back and forward in user defined time window, allows individual time setting for each Graph, values read directly in Graph by dragging mouse over the curve and much more
Category: Multimedia & Design / Multimedia App's
Publisher: CBIM, License: Freeware, Price: USD $0.00, File Size: 311.0 KB
Platform: Windows
Drawing graphs without the right tool is simply difficult.
Drawing graphs without the right tool is simply difficult. uDraw(Graph) automates this task for you. Find out how uDraw(Graph) creates your flow charts, diagrams, hierarchies or structure visualizations using automatic layout - much faster than with any standard drawing program. With the API, uDraw(Graph) can even be embedded in your own programs as a visualization component.
Category: Multimedia & Design / Image Editing
Publisher: University Bremen, FB3, Germany, License: Freeware, Price: USD $0.00, File Size: 2.6 MB
Platform: Windows
XYGraph is a native . NET charting component showing data in a cartesian graph (X,Y).
Controls from componentXtra gives royalty free software integration. Both the free and purchased products includes sample code (VB and C#). .
Category: Software Development
Publisher: componentXtra, License: Freeware, Price: USD $0.00, File Size: 390.6 KB
Platform: Windows
Assembly Analyzer allows the user to view the resources and metadata contained within .
Assembly Analyzer allows the user to view the resources and metadata contained within .NET assemblies.
It also contains a disassembler that displays source Code for methods and dependencies, including call graphs.
Assembly Analyzer is easy to use and is a freeware.
Main Features:
- View assembly metadata
- View assembly resources
- View MSIL...
Category: Software Development / Misc. Programming
Publisher: Assembly Analyzer, License: Shareware, Price: USD $0.00, File Size: 0
Platform: Windows
The Extension Manager 1.7 is an application that is part of the Fireworks 8 and Flash 8. Extension Manager lets you easily install new programs called "extensions" and keep track new ones, wich you must download it from the Macromedia Exchange site.
You can create an Extension that be compatible with Macromedia Fireworks or Macromedia Flash; in this...
Category: Software Development / Components & Libraries
Publisher: Macromedia, Inc., License: Freeware, Price: USD $0.00, File Size: 22.2 MB
Platform: Windows
ImageApp is a program that involves a lot of principles from machine vision.
ImageApp is a program that involves a lot of principles from machine vision. A GUI that allows you to build up an image processing Graph. An image processing Graph is essentially a sequence of algorithms that do something to images. You can imagine the Graph as the algorithms being the nodes and the flow-of-->data between the algorithms being the arcs.
For...
Category: Multimedia & Design / Multimedia App's
Publisher: Laurence Smith, License: Shareware, Price: USD $0.00, File Size: 0
Platform: Windows
The WebViewer plug-in enables Windows users whether or not they have SigmaPlot to explore the data used to create the Graph.
Using the WebViewer plug-in with your Web browser window you can:
- View the data used to create the Graph
- Print a Graph in a web document at full resolution
- Zoom in and out of a Graph
- Grab and...
Category: Multimedia & Design / Graphics Viewers
Publisher: SYSTAT Software Inc., License: Freeware, Price: USD $0.00, File Size: 12.6 MB
Platform: Windows
With The Option Strategy Builder you could pick up an option and place it directly to the return Graph. As with the online tool, just drag and drop the option on the Graph, and build your strategy. Using your mouse, the options can be easily moved on the Graph to different strike prices, and to different expiration dates.
With this program you can manage your...
Category: Multimedia & Design / Multimedia App's
Publisher: SamoaSky, License: Freeware, Price: USD $0.00, File Size: 3.1 MB
Platform: Windows

Audio Graph ActiveX is an ActiveX (OCX) component for software developers. With this ActiveX component you can display a meter, detect a silence, and display 2 types of audio graphs by the WaveIn/WaveOut buffers. Just send a pointer of the buffers array to the component then operate the Display function, the component will do the rest on the Graph view. You can set the...
Category: Software Development
Publisher: expresslib.com, License: Shareware, Price: USD $69.00, File Size: 806.5 KB
Platform: Windows
The Native Barcode Generator Plug-In is a FileMaker Extension that may be easily inserted into a FileMaker report to create bar Code images. Once implemented, no other components or fonts need to be installed to create barcodes. The plug-in provides formulas, that when displayed in a report, create a barcode image from an already installed system font. Supported symbologies...
Category: Software Development / Components & Libraries
Publisher: IDAutomation.com, Inc., License: Shareware, Price: USD $149.00, File Size: 173.0 KB
Platform: Windows
Excel Graph Multiple Equations Software is an application that allows you to plot multiple functions in Microsoft Excel. It is able to create multiple charts based on the formulas entered. You can enter an equation manually or load multiple equations from a text file (.txt). The application is able to plot each equation on an individual Graph or all the equations on a single...
Category: Business & Finance / MS Office Addons
Publisher: Sobolsoft, License: Shareware, Price: USD $19.99, File Size: 2.5 MB
Platform: Windows
New Features of DataStudio:
- Video Player and Synchronization -- Play a movie or synch a movie to experimental data
- Presentation Style Graph -- Additional Graph style that moves measurements and units outside the Graph; ideal for publication of DataStudio graphs in educational journals
- Predictive Sketching -- Students can draw directly on the...
Category: Home & Education / Miscellaneous
Publisher: PASCO, License: Demo, Price: USD $0.00, File Size: 32.8 MB
Platform: Windows

Archim is a program for drawing the graphs of all kinds of functions. You can define a Graph explicitly and parametrically, in polar and spherical coordinates, on a plane and in space (surface). Archim will be useful for teachers and students, as well as for everyone who is interested min geometry. With Archim, you will draw the Graph of any function and form, just use your...
Category: Home & Education
Publisher: Stochastic Lab, License: Freeware, Price: USD $0.00, File Size: 479.6 KB
Platform: Windows
Graph-A-Ping allows you to visually see the ping latency between ping times.
Graph-A-Ping allows you to visually see the ping latency between ping times. The bigger the gap between one ping to another allows you to spot possible network bottle neck.
This tool is actually an applet part of Glass Net Networks monitoring console.
Category: Internet / Misc. Plugins
Publisher: Mataluis.Com, License: Freeware, Price: USD $0.00, File Size: 2.1 MB
Platform: Windows
GraphPad Prism is a highly efficient tool capable of doing all mathematical calculations as well as graphical plotting such as curve fitting. It’s not just an ordinary application that makes plotting easier, but also a powerful one that can be utilized even for the superior purposes such as scientific graphics.
Even the way of its operation is very convenient as it...
Category: Business & Finance / Applications
Publisher: GraphPad Software, License: Demo, Price: USD $570.00, File Size: 18.6 MB
Platform: Windows
Graph FAWM is a function graphing tool that is easy for teachers and students to use.
Graph FAWM is a function graphing tool that is easy for teachers and students to use. A wealth of information is available about any Graph just by moving the mouse pointer to a point of interest.
Category: Business & Finance / Applications
Main Features:
- True algebraic equation format
- Implicit equations
- Locates intercepts, turning points and points of intersection
Publisher: New FAWM Creations, License: Shareware, Price: USD $20.00, File Size: 4.6 MB
Platform: Windows
XYZ Data Viewer is a Excel table to 3-D graph converter.
XYZ Data Viewer is a Excel table to 3-D Graph converter. It provide easy way to analyze a variety of tabular data from Microsoft Excel in the view of 3-dimensions Graph. With this tool You can view and examine your data as a three-dimensional object in three-dimensional space, by manipulate the 3d object on the program screen. You can save this 3d Graph as a file and upload...
Category: Multimedia & Design / Media Management
Publisher: 3 Fish Software, License: Shareware, Price: USD $69.95, File Size: 9.1 MB
Platform: Windows
dcsDigitiser, a Graph digitizer and densitometer, converts graphs into digital X-Y numerical numbers for peer analysis of graphs and gel in the open literature and/or of your own hard copies. With excellent performance, dcsDigitiser is accurate, precise, versatile and straightforward in its use. It is now only a few clicks to get a numerical reading of graphs of interest while surfing on...
Category: Home & Education / Mathematics
Publisher: J & C Consultation and Technology, License: Shareware, Price: USD $120.00, File Size: 3.8 MB
Platform: Windows