Free Downloads: Free Graph
 Freeware
Free Graph Generator is a simple bar chart generation tool that lets you create custom bar charts of any size. Edit bar color, bar width, bar title, and bar side label properties.
Category: Home & Education / Mathematics
Publisher: Innovative Creations Software, License: Freeware, Price: USD $0.00, File Size: 16.5 MB
Platform: Windows
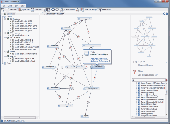
Graph visualization is a way of representing structural information as diagrams of abstract graphs and networks. Automatic Graph drawing has many important applications in software engineering, database and web design, networking, and in visual interfaces
Category: Multimedia & Design
Publisher: graphviz.org, License: Freeware, Price: USD $0.00, File Size: 26.6 MB
Platform: Windows, Mac, Vista
2D / 3D Area Graph provides both a client and server side solution for the incorporation of area graphs into web pages. It provides versatile components so that web authors and Java developers can easily build and publish dynamic and interactive area graphs. With many configurable features and functions to both applet and servlet, the documentation and examples are designed to give both...
Category: Business & Finance
Publisher: Sirius Computer Consultants Limited, License: Shareware, Price: USD $49.00, File Size: 212.6 KB
Platform: Windows, Linux, OS/2, Mac, Unix, MS-DOS
The NetGraph – network monitor 2.
The NetGraph – network monitor 2.0 is a software network-monitoring program that enables users to see at a glance the activities on their networks including the volumes of traffic with four simple Graph mode indicators.
The program works on any Windows’ network connection and NetGraph – network monitor 2.0’s four modes include 2 snapshot modes and 2...
Category: Internet / Monitoring
Publisher: Nikola Dachev, License: Freeware, Price: USD $0.00, File Size: 0
Platform: Windows
Graphe Easy is a feature-rich yet easy-to-use 2d-graph plotting Windows software.
Graphe Easy is a feature-rich yet easy-to-use 2d-Graph plotting Windows software. It allows to draw many Graph types (cartesian, polar, parametric coordinates) and many other graphs such as conics, integrals, inequations or sequences. It also provides a wide range of tools to comment on the graphics and get high quality results.
Category: Utilities / System Utilities
Publisher: Olivier ANSQUER, License: Shareware, Price: USD $39.00, File Size: 4.2 MB
Platform: Windows
This Free program plots in realtime all data sent and received using the Dial-Up Networking Adapter and Modem. Shows separate sent, received, send rate, received rate, peaks and totals. Five graphs and statistics. Animated System Tray Icon. Allows you to change colours, Graph size, sample seconds, 3D Graph, axis and more. Full automated self-upgrade. Autostart with...
Category: Internet / Dial-up & Connectivity
Publisher: Ashok Kumar Parmar, License: Freeware, Price: USD $0.00, File Size: 819.2 KB
Platform: Windows
Freeware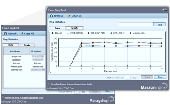
The ManageEngine Free Ping tool is a simple yet powerful tool with an elegant UI that helps to issue ping requests to "Multiple IP Addresses" in a single instance. And can find the health of the sever continuously for a maximum of 10 hosts. The ping data such as Ipaddress, RoundTripTime, Time To Live (Ttl), Buffer Size and the status are shown in a table. The ManageEngine Free...
Category: Internet / Tools & Utilities
Publisher: ZOHO Corporation, License: Freeware, Price: USD $0.00, File Size: 1.5 MB
Platform: Windows
To succeed in mathematics, one must be able to solve the problems.
To succeed in mathematics, one must be able to solve the problems. MathXpert can help you learn to solve the problems in your mathematics course.
MathXpert was designed to replace blackboards and homework, not teachers and books.
When you press the Graph button, you immediately get a Graph of the expression or equation in the current calculation. MathXpert will choose...
Category: Home & Education / Mathematics
Publisher: Michael Beeson, License: Shareware, Price: USD $89.95, File Size: 15.5 MB
Platform: Windows
MathTrax is a graphing tool for middle school and high school students to Graph equations, physics simulations or plot data files.
The graphs have descriptions and sound so you can hear and read about the Graph. Blind and low vision users can access visual math data and Graph or experiment with equations and datasets.
Category: Business & Finance / Applications
Publisher: The MathTrax Team, License: Freeware, Price: USD $0.00, File Size: 21.0 MB
Platform: Windows
Visual Complex is a graph software to create graphs of complex variable functions.
Visual Complex is a Graph software to create graphs of complex variable functions.
Features:
-Creating 3D graphs of complex functions
-Creating color maps of complex functions
-Ability to edit Graph interactively
-Ability to copy and save Graph as bitmap.
Category: Multimedia & Design / Multimedia App's
Publisher: GraphNow Software, License: Shareware, Price: USD $25.00, File Size: 2.0 MB
Platform: Windows
XYGraph is a native . NET charting component showing data in a cartesian graph (X,Y).
Controls from componentXtra gives royalty free software integration. Both the free and purchased products includes sample code (VB and C#). .
Category: Software Development
Publisher: componentXtra, License: Freeware, Price: USD $0.00, File Size: 390.6 KB
Platform: Windows

Obtain data from images of graphs scanned from articles or available as image. Import the Graph into ScanIt from a scanner or file, or from the clipboard. Define locations of the Graph's axes by indicating known points. Extract data from the Graph by manually picking points, by scanning for points or by scanning along curves. Copy the scanned data to Excel or export data to...
Category: Home & Education / Science
Publisher: amsterchem, License: Freeware, Price: USD $0.00, File Size: 6.1 MB
Platform: Windows
The DOP software can visualize the input from your scale and show it as a graph.
The DOP software can visualize the input from your scale and show it as a Graph. All input data from the device are stored in the DOP and therefore it is possible to zoom in and out, store the data on disk and to analyze the data more carefully.
You can also print the Graph or save it as JPG and use it for documentation.
Category: Multimedia & Design / Multimedia App's
Publisher: Hauch & Bach ApS., License: Shareware, Price: USD $0.00, File Size: 457.4 KB
Platform: Windows
RM Starting Graph is an easy-to-use graphing package that provides younger pupils with the ideal introduction to information handling.
This much loved software is now compatible with Windows Vista as well as having a version for Community Connect 4.
RM Starting Graph has been developed with the user in mind, and is ideal for developing initial numeracy...
Category: Home & Education / Teaching Tools
Publisher: Research Machines plc., License: Shareware, Price: USD $0.00, File Size: 0
Platform: Windows
RJS Graph produces professional scientific and mathematical graphs.
RJS Graph produces professional scientific and mathematical graphs. You may study the data with a wide range of data analysis tools. Features include the ability to plot data and equations, fit best fit curves and splines, and display fitted best fit curve parameters. Data can be pasted from a spreadsheet or imported from a text file using a wizard.
Category: Home & Education / Mathematics
Publisher: RJS, License: Freeware, Price: USD $0.00, File Size: 3.7 MB
Platform: Windows
WTides is a Free program that uses harmonics data to predict tide heights at many locations throughout the World, and displays a Graph of the results according to the time zone of the target location. The tide Graph can be overlaid with a solunar chart to give an interesting version of the Maori Fishing Calendar. The program runs on any version of Microsoft Windows from...
Category: Multimedia & Design / Digital Media Editors
Publisher: Managing Data Resources (NZ) Ltd, License: Freeware, Price: USD $0.00, File Size: 601.9 KB
Platform: Windows
T&D Graph has been designed as a user friendly software which brings users even more effective tools for the management and analysis of data recorded by T&D Data Loggers. It contains a variety of useful functions including the ability to read and merge multiple data files and display recorded data in Graph and/or list form.
Category: Software Development / Misc. Programming
Publisher: T&D CORPORATION, License: Freeware, Price: USD $0.00, File Size: 11.3 MB
Platform: Windows
This 2D / 3D Horizontal Bar Graph provides both a client and server side solution for the incorporation of bar graphs into web pages. It provides versatile components so that web authors and Java developers can easily build and publish dynamic and interactive bar graphs. We have built in many configurable features and functions to both the applet and servlet and as such, the...
Category: Internet
Publisher: Sirius Computer Consultants Limited, License: Shareware, Price: USD $49.00, File Size: 359.2 KB
Platform: Windows, Linux, OS/2, Mac, Unix, MS-DOS
Function Analyzer is a program that draws the Graph of a function with one variable declared by the user. The operators used to build the mathematical expression are the usual ones used in software calculators: * for multiplying, / for dividing, ^ for power and so on. Parentheses can be used to group terms in your expression. Trigonometric functions are also supported, along with a few...
Category: Home & Education / Mathematics
Publisher: Lorenzi Davide, License: Freeware, Price: USD $0.00, File Size: 1.3 MB
Platform: Windows
Graph Digitizer Scout automatically converts hard-copy graphs, oscillograms, charts, plots, into X,Y. Different recognition methods including manual correction mode. Data can be exported to Excel, CSV format and other applications.
Category: Home & Education / Mathematics
Publisher: ByteScout, License: Demo, Price: USD $35.00, File Size: 5.2 MB
Platform: Windows
JGraph is the leading Open Source Java Graph Visualization Library.
JGraph is the leading Open Source Java Graph Visualization Library. It follows Swing design patterns to provide an API familiar to Swing programmers and functionality that provides a range of features. Graph visualization is a central requirement for applications such as workflow editors, computer and telecommunication networks display, flowcharts, VLSI and CAD, business process...
Category: Software Development / Components & Libraries
Publisher: JGraph Ltd, License: Freeware, Price: USD $0.00, File Size: 136.0 KB
Platform: Windows, Linux, Mac
Atlantis Schema Surf is our SQL dependency & live entity ER diagram tool - it is a Free animated graphing tool which allows you to easily visualize the dependencies between the objects in your SQL Server databases in a live entity ER diagram.
Schema Surf, like it's counterpart Data Surf, contains a "Surf Graph" which allows you to easily view an object and the...
Category: Business & Finance / Database Management
Publisher: Atlantis Interactive UK Ltd., License: Freeware, Price: USD $0.00, File Size: 7.4 MB
Platform: Windows
The Vertical Bar Graph API is a Java Bean Component. Designed specifically to enable programmers to easily add powerful graphing functionality to any form of Java application Download the Free Trial today for access to:- - Documentation - Code samples - Demo Applications - IDE specific instructions and much more.
Category: Software Development
Publisher: Sirius Computer Consultants Limited, License: Shareware, Price: USD $79.00, File Size: 519.0 KB
Platform: Windows, Linux, OS/2, Mac, Unix
Add Powerful reporting features to your Web / Intranet pages and applications. With the advanced graphing package you will be quickly adding impressive dynamic charting capabilities bringing your data alive ! Powerful components provide both client & server side solutions for adding graphs & charts into web / intranet pages & applications. Enabling web authors & Java developers to easily build...
Category: Internet
Publisher: Sirius Computer Consultants Limited, License: Shareware, Price: USD $195.00, File Size: 389.6 KB
Platform: Windows, Linux, OS/2, Mac, Unix
Graph Component provides 2D plotting facilities, it accepts any number of curves and provides user with ability to zoom, resize and print.
Graph Component works in two modes:
Offline Mode: In this mode the whole drawing points must be provided, the components render this points after calculating the appropriate scale. This mode supports linear and log scale, also it...
Category: Business & Finance / Applications
Publisher: MathTools, License: Shareware, Price: USD $49.00, File Size: 1.9 MB
Platform: Windows