Free Downloads: Function Graph Program
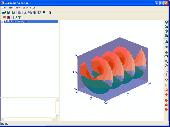
Complex Grapher is a graphing calculator to create a Graph of complex Function. 3D Function graphs and 2D color maps can be created with this grapher. You can input complex functions in the form of w=f(z) (where z=x+yi) directly before creacting graphs. Graphs can be copied and saved in the format of bitmap.Complex Grapher is a graphing calculator to create a Graph...
Category: Home & Education
Publisher: GraphNow, License: Shareware, Price: USD $19.95, File Size: 976.6 KB
Platform: Windows
Chart java applet software to generate dynamic charts and graphs within JSP, servlets or java applications - bar, line, pie, stacked and grouped charts in 2D and 3D with a wide range of parameters and chart types. Main features: Charts in 2D/3D, Anti aliasing, Multi language support, Cross browser compatible, Java Script parameter control, Data labels, Contextual data drill down, CSV data...
Category: Software Development
Publisher: Swiftchart Limited, License: Demo, Price: USD $99.00, File Size: 97.7 KB
Platform: Windows, Mac, Linux, Unix, MS-DOS, AS/400
Chart java applet software to generate dynamic charts and graphs within JSP, servlets or java applications - bar, line, pie, stacked and grouped charts in 2D and 3D with a wide range of parameters and chart types. Main features: Charts in 2D/3D, Anti aliasing, Multi language support, Cross browser compatible, Java Script parameter control, Data labels, Contextual data drill down, CSV data...
Category: Software Development / Tools & Editors
Publisher: Swiftchart Limited, License: Demo, Price: USD $99.00, File Size: 97.0 KB
Platform: Windows, Mac, Linux, Unix, MS-DOS, AS, 400
XYZ Data Viewer is a Excel table to 3-D graph converter.
XYZ Data Viewer is a Excel table to 3-D Graph converter. It provide easy way to analyze a variety of tabular data from Microsoft Excel in the view of 3-dimensions Graph. With this tool You can view and examine your data as a three-dimensional object in three-dimensional space, by manipulate the 3d object on the Program screen. You can save this 3d Graph as a file and...
Category: Multimedia & Design / Media Management
Publisher: 3 Fish Software, License: Shareware, Price: USD $69.95, File Size: 9.1 MB
Platform: Windows
Visual Stats is a statistics Program to implement data analysis and multivariate statistical analysis.
The Program features and easy-to-use Excel-like data editor. Probability, enables you to compute and Graph probability density Function values, cumulative distribution Function values, survival Function values, hazard Function values,...
Category: Business & Finance / Applications
Publisher: GraphNow Software, License: Shareware, Price: USD $120.00, File Size: 2.6 MB
Platform: Windows
Math tool for high school teachers and students. Function graphing and analyzing: 2D, 2.5D Function graphs and animations, extrema, root, tangent, limit,derivative, integral, inverse; sequence of number: arithmetic progression, geometric progression; analytic geometry: vector, line, circle, ellipse, hyperbola and parabola; solid geometry: spatial line, prism, pyramid, cylinder,...
Category: Home & Education / Mathematics
Publisher: GraphNow, License: Shareware, Price: USD $29.95, File Size: 2.3 MB
Platform: Unknown
This program is designed to assist engineers in studying the (loads) forces acting on rods.
This Program is designed to assist engineers in studying the (loads) forces acting on rods. Once all data is entered, the user can select the Update Graph button to see the rod load Graph for the modeled situation. In general, whenever the user makes changes to the data, the Program will automatically update the Graph.
Category: Business & Finance / Business Finance
Publisher: ACI Services, Inc., License: Demo, Price: USD $0.00, File Size: 2.8 MB
Platform: Windows
Math Mechanixs is an easy to use scientific and engineering FREE math software Program. (FREE registration is required after 60 days). The typical tool for solving mathematical problem has been the calculator. Unfortunately, a calculator can be very limiting. They do not allow the user to record detailed notes regarding their work. Until the graphing calculator, the user could not...
Category: Business & Finance
Publisher: Math Mechanixs, LLC., License: Freeware, Price: USD $0.00, File Size: 8.7 MB
Platform: Windows
Enhanced programmable calculator
The most easy and complet programmable RPN calculator in Internet. Compare it with any other you can find! It will accept arithmetic expressions or functions: for example to compute the expression (1+a^2)*((a-1)/(a+1) you have to insert (or paste from clipboard) the expression as it's written, insert a value for a and press 'enter'. Graph plotting of a Function - Computing of...
Category: Home & Education / Mathematics
Publisher: Lis Schmitz & Mario Cazorzi, License: Shareware, Price: USD $35.00, File Size: 2.5 KB
Platform: Unknown
The WebViewer plug-in enables Windows users whether or not they have SigmaPlot to explore the data used to create the Graph.
Using the WebViewer plug-in with your Web browser window you can:
- View the data used to create the Graph
- Print a Graph in a web document at full resolution
- Zoom in and out of a Graph
- Grab and...
Category: Multimedia & Design / Graphics Viewers
Publisher: SYSTAT Software Inc., License: Freeware, Price: USD $0.00, File Size: 12.6 MB
Platform: Windows
A&G Grapher is a powerful graphing application that allows you to draw any 2D and 3D mathematical equation. It can be used by beginners and advanced users as well. This new version is fully automated, and offers faster drawing, more precise drawing of complex equations, enhanced new user-interface, even easier to use than before.
With this Program you can use both simple and...
Category: Home & Education / Mathematics
Publisher: Runiter Company, License: Shareware, Price: USD $29.95, File Size: 2.8 MB
Platform: Windows
Fly-through 3D graph software for exciting presentations, marketing, sales, analysis and fun!
Fly-through 3D Graph software for exciting presentations, marketing, sales, analysis and fun! Capture the attention of your audience with spectacular 3D technology. Instead of showing your audience another boring line Graph, capture their interest with something wildly different. They will be more likely to talk about and remember your presentation that had something that stood...
Category: Business & Finance
Publisher: Swan Studios, License: Shareware, Price: USD $39.95, File Size: 8.5 MB
Platform: Windows
ZGrapher is a simple graphic utility.
ZGrapher is a simple graphic utility. It can be helpful for any user, from a schoolboy to a professional mathematician. Using this Program you can plot graphs of the following types: Y(x), X(y), R(a) – in polar coordinates, X(t) and Y(t) – parametric equations and graphs of tables. To create a Graph you should specify its parameters – formula,...
Category: Home & Education / Mathematics
Publisher: Palam Software, Inc., License: Freeware, Price: USD $0.00, File Size: 619.8 KB
Platform: Windows
Excel Graph Multiple Equations Software is an application that allows you to plot multiple functions in Microsoft Excel. It is able to create multiple charts based on the formulas entered. You can enter an equation manually or load multiple equations from a text file (.txt). The application is able to plot each equation on an individual Graph or all the equations on a single...
Category: Business & Finance / MS Office Addons
Publisher: Sobolsoft, License: Shareware, Price: USD $19.99, File Size: 2.5 MB
Platform: Windows
New Features of DataStudio:
- Video Player and Synchronization -- Play a movie or synch a movie to experimental data
- Presentation Style Graph -- Additional Graph style that moves measurements and units outside the Graph; ideal for publication of DataStudio graphs in educational journals
- Predictive Sketching -- Students can draw directly on the...
Category: Home & Education / Miscellaneous
Publisher: PASCO, License: Demo, Price: USD $0.00, File Size: 32.8 MB
Platform: Windows
Plot Digitizer is a great piece of software developed by Joseph A.
Plot Digitizer is a great piece of software developed by Joseph A. Huwaldt. The main goal of the Program is to extract information from two-dimensional plots or graphs. It is very common to find information the form of a plot or Graph, showing the relation between two variables. However, this information will not be useful until data is converted to standard x-y values (table...
Category: Multimedia & Design / Multimedia App's
Publisher: Joseph A. Huwaldt, License: Freeware, Price: USD $0.00, File Size: 4.4 MB
Platform: Windows
Statistical analysis and report-ready chart.
LeoReport is a software application for generating inspired report-ready graphic presentation of statistical analysis of diversity of data. It's fast, portable, user-friendly with intuitive interface. LeoReport can create: a histogram of variable distribution with comparison Student and Poisson probability functions; two arguments distribution with 3D and color map presentation; curve fitting...
Category: Home & Education / Mathematics
Publisher: Leonid Sakharov, License: Shareware, Price: USD $99.95, File Size: 490.0 KB
Platform: Unknown
RM Starting Graph is an easy-to-use graphing package that provides younger pupils with the ideal introduction to information handling.
This much loved software is now compatible with Windows Vista as well as having a version for Community Connect 4.
RM Starting Graph has been developed with the user in mind, and is ideal for developing initial numeracy...
Category: Home & Education / Teaching Tools
Publisher: Research Machines plc., License: Shareware, Price: USD $0.00, File Size: 0
Platform: Windows
The Library GraphDiag is intended for building Graph and diagrams on HBITMAP, surface DirectDraw and in file BMP format. The Library can build the graphs on entered text line and diagrams, as from tables, which format is provided by developer, so and from files HTML-format and from XLS files Excel. Given version first and is not deprived defect and restrictions. The Restrictions are of...
Category: Software Development / Components & Libraries
Publisher: Kruchinin Aleksandr, License: Freeware, Price: USD $0.00, File Size: 67.0 KB
Platform: Windows
Graph-A-Ping allows you to visually see the ping latency between ping times.
Graph-A-Ping allows you to visually see the ping latency between ping times. The bigger the gap between one ping to another allows you to spot possible network bottle neck.
This tool is actually an applet part of Glass Net Networks monitoring console.
Category: Internet / Misc. Plugins
Publisher: Mataluis.Com, License: Freeware, Price: USD $0.00, File Size: 2.1 MB
Platform: Windows
aiSee reads a textual, easy-to-read and easy-to-learn Graph specification and automatically calculates a customizable Graph layout. This layout is then displayed, and can be interactively explored, printed and exported to various graphic formats.
See has been optimized to handle huge graphs automatically generated by applications. It is available for Windows, Linux, and Mac...
Category: Home & Education / Miscellaneous
Publisher: Ai-See, License: Shareware, Price: USD $395.00, File Size: 18.2 MB
Platform: Windows
Also, allows flying. Screen Saver included. .
Category: Home & Education / Mathematics
Publisher: Aepryus, License: Shareware, Price: USD $30.00, File Size: 1.4 KB
Platform: Unknown
CoGui is a free Graph-based visual tool, developed in Java, for building Conceptual Graph knowledge bases represented in COGXML format, compatible with Cogitant.
Category: Multimedia & Design / Video
Features:
- Intuitive visual structures for building real-world knowledge bases
- Reasoning capabilities with Cogitant
- XML persistent storage
Functionalities:
Publisher: LIRMM, License: Shareware, Price: USD $0.00, File Size: 0
Platform: Windows
WTides is a free Program that uses harmonics data to predict tide heights at many locations throughout the World, and displays a Graph of the results according to the time zone of the target location. The tide Graph can be overlaid with a solunar chart to give an interesting version of the Maori Fishing Calendar. The Program runs on any version of Microsoft Windows...
Category: Multimedia & Design / Digital Media Editors
Publisher: Managing Data Resources (NZ) Ltd, License: Freeware, Price: USD $0.00, File Size: 601.9 KB
Platform: Windows
Graph visualization is a way of representing structural information as diagrams of abstract graphs and networks. Automatic Graph drawing has many important applications in software engineering, database and web design, networking, and in visual interfaces
Category: Multimedia & Design
Publisher: graphviz.org, License: Freeware, Price: USD $0.00, File Size: 26.6 MB
Platform: Windows, Mac, Vista