Free Downloads: Graph Editing Statistics
Smart Photo Statistics is designed to gather various types of photographic statistics.
Smart Photo Statistics is designed to gather various types of photographic Statistics. The user can view Statistics such as: camera model, focal length, flash used, sensitivity etc. The data can be exported either as text or in a graphics format.
Category: Multimedia & Design / Graphics Viewers
Publisher: softsymphony.com, License: Freeware, Price: USD $0.00, File Size: 670.0 KB
Platform: Windows
With The Option Strategy Builder you could pick up an option and place it directly to the return Graph. As with the online tool, just drag and drop the option on the Graph, and build your strategy. Using your mouse, the options can be easily moved on the Graph to different strike prices, and to different expiration dates.
With this program you can manage your...
Category: Multimedia & Design / Multimedia App's
Publisher: SamoaSky, License: Freeware, Price: USD $0.00, File Size: 3.1 MB
Platform: Windows
Audio Graph ActiveX is an ActiveX (OCX) component for software developers. With this ActiveX component you can display a meter, detect a silence, and display 2 types of audio graphs by the WaveIn/WaveOut buffers. Just send a pointer of the buffers array to the component then operate the Display function, the component will do the rest on the Graph view. You can set the...
Category: Software Development
Publisher: expresslib.com, License: Shareware, Price: USD $69.00, File Size: 806.5 KB
Platform: Windows
Excel Graph Multiple Equations Software is an application that allows you to plot multiple functions in Microsoft Excel. It is able to create multiple charts based on the formulas entered. You can enter an equation manually or load multiple equations from a text file (.txt). The application is able to plot each equation on an individual Graph or all the equations on a single...
Category: Business & Finance / MS Office Addons
Publisher: Sobolsoft, License: Shareware, Price: USD $19.99, File Size: 2.5 MB
Platform: Windows
New Features of DataStudio:
- Video Player and Synchronization -- Play a movie or synch a movie to experimental data
- Presentation Style Graph -- Additional Graph style that moves measurements and units outside the Graph; ideal for publication of DataStudio graphs in educational journals
- Predictive Sketching -- Students can draw directly on the...
Category: Home & Education / Miscellaneous
Publisher: PASCO, License: Demo, Price: USD $0.00, File Size: 32.8 MB
Platform: Windows
Visual Stats is a Statistics program to implement data analysis and multivariate statistical analysis.
The program features and easy-to-use Excel-like data editor. Probability, enables you to compute and Graph probability density function values, cumulative distribution function values, survival function values, hazard function values, quantile values, means and variances....
Category: Business & Finance / Applications
Publisher: GraphNow Software, License: Shareware, Price: USD $120.00, File Size: 2.6 MB
Platform: Windows
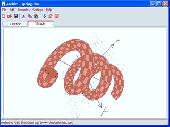
Archim is a program for drawing the graphs of all kinds of functions. You can define a Graph explicitly and parametrically, in polar and spherical coordinates, on a plane and in space (surface). Archim will be useful for teachers and students, as well as for everyone who is interested min geometry. With Archim, you will draw the Graph of any function and form, just use your...
Category: Home & Education
Publisher: Stochastic Lab, License: Freeware, Price: USD $0.00, File Size: 479.6 KB
Platform: Windows
STATDISK is a software program designed specifically for use with textbooks in the Triola Statistics Series:
- Elementary Statistics
- Elementary Statistics Using Excel¨
- Essentials of Statistics
- Elementary Statistics Using the Graphing Calculator: For the TI-83/84 Plus
- Biostatistics for the Biological and Health Sciences
Category: Home & Education / Miscellaneous
Publisher: Password, Inc., License: Freeware, Price: USD $0.00, File Size: 3.2 MB
Platform: Windows
Graph-A-Ping allows you to visually see the ping latency between ping times.
Graph-A-Ping allows you to visually see the ping latency between ping times. The bigger the gap between one ping to another allows you to spot possible network bottle neck.
This tool is actually an applet part of Glass Net Networks monitoring console.
Category: Internet / Misc. Plugins
Publisher: Mataluis.Com, License: Freeware, Price: USD $0.00, File Size: 2.1 MB
Platform: Windows
Web Statistics Montage is a free tool that compiles web Statistics from multiple web sites and sends them to you in an easy-to-read, easy-to-compare format without having to log in anywhere! Just set up a simple configuration file, upload the files to your site and you're done. Web Statistics Montage gathers Statistics like search engine spider activity, the...
Category: Software Development
Publisher: www.Search-Engine-Optimized.com, License: Freeware, Price: USD $0.00, File Size: 11.9 KB
Platform: Windows, Linux, Unix
Graph FAWM is a function graphing tool that is easy for teachers and students to use.
Graph FAWM is a function graphing tool that is easy for teachers and students to use. A wealth of information is available about any Graph just by moving the mouse pointer to a point of interest.
Category: Business & Finance / Applications
Main Features:
- True algebraic equation format
- Implicit equations
- Locates intercepts, turning points and points of intersection
Publisher: New FAWM Creations, License: Shareware, Price: USD $20.00, File Size: 4.6 MB
Platform: Windows
XYZ Data Viewer is a Excel table to 3-D graph converter.
XYZ Data Viewer is a Excel table to 3-D Graph converter. It provide easy way to analyze a variety of tabular data from Microsoft Excel in the view of 3-dimensions Graph. With this tool You can view and examine your data as a three-dimensional object in three-dimensional space, by manipulate the 3d object on the program screen. You can save this 3d Graph as a file and upload...
Category: Multimedia & Design / Media Management
Publisher: 3 Fish Software, License: Shareware, Price: USD $69.95, File Size: 9.1 MB
Platform: Windows
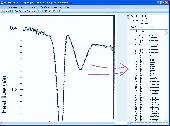
dcsDigitiser, a Graph digitizer and densitometer, converts graphs into digital X-Y numerical numbers for peer analysis of graphs and gel in the open literature and/or of your own hard copies. With excellent performance, dcsDigitiser is accurate, precise, versatile and straightforward in its use. It is now only a few clicks to get a numerical reading of graphs of interest while surfing on...
Category: Home & Education / Mathematics
Publisher: J & C Consultation and Technology, License: Shareware, Price: USD $120.00, File Size: 3.8 MB
Platform: Windows
Main features: -simple and well arranged environment-evidence accounts-money transfer to other user-move cash between accounts-differential calculation-too much Statistics: month briefing (Graph/table), Yearly dearance, daily extract, economy, individual subcategories graphs, extract finances in individual categories, extract in time sequence, complete extract, main category...
Category: Business & Finance / Personal Finance
Publisher: petoh, License: Shareware, Price: USD $32.00, File Size: 1.3 MB
Platform: Windows
aiSee reads a textual, easy-to-read and easy-to-learn Graph specification and automatically calculates a customizable Graph layout. This layout is then displayed, and can be interactively explored, printed and exported to various graphic formats.
See has been optimized to handle huge graphs automatically generated by applications. It is available for Windows, Linux, and Mac...
Category: Home & Education / Miscellaneous
Publisher: Ai-See, License: Shareware, Price: USD $395.00, File Size: 18.2 MB
Platform: Windows
Graph Extract is a program for digitizing plots.
Graph Extract is a program for digitizing plots. Using either manual or automated approaches, this program provides a means to easily extract numeric data from plots. The resulting X-Y data can be printed or replotted, or it can be saved in Excel file for
Category: Multimedia & Design
Publisher: quadtechassociates.com, License: Freeware, Price: USD $0.00, File Size: 446.0 KB
Platform: Windows
CoGui is a free Graph-based visual tool, developed in Java, for building Conceptual Graph knowledge bases represented in COGXML format, compatible with Cogitant.
Category: Multimedia & Design / Video
Features:
- Intuitive visual structures for building real-world knowledge bases
- Reasoning capabilities with Cogitant
- XML persistent storage
Functionalities:
Publisher: LIRMM, License: Shareware, Price: USD $0.00, File Size: 0
Platform: Windows
Graph visualization is a way of representing structural information as diagrams of abstract graphs and networks. Automatic Graph drawing has many important applications in software engineering, database and web design, networking, and in visual interfaces
Category: Multimedia & Design
Publisher: graphviz.org, License: Freeware, Price: USD $0.00, File Size: 26.6 MB
Platform: Windows, Mac, Vista
Contest LogChecker is a set of contest tools for Microsoft Windows, combining advanced text Editing with keyword highlighted, and the ease and flexibility of import, export, Statistics and charting utilities.
With LogChecker you can edit, fill in the log, check Cabrillo Format and Header, convert files from the most popular logging software to Cabrillo, print...
Category: Utilities / Misc. Utilities
Publisher: Igor Tolmachev (UU0JC), License: Shareware, Price: USD $0.00, File Size: 4.4 MB
Platform: Windows
Cricket Statz Pro is the most advanced cricket Statistics software available to those that are serious about their Statistics. It is designed to provide an extensive range of Statistics for teams, clubs, associations, statisticians and individuals. Simply enter scorecard details and Cricket Statz Pro will produce professional reports and graphs.
Category: Home & Education / Miscellaneous
Publisher: Red Axe Software, License: Shareware, Price: USD $69.00, File Size: 2.3 MB
Platform: Windows
This material enables IBM SPSS Statistics users to run code written in the R language inside Statistics.
Download Essentials and plugins for Statistics and later, utilities, supplementary modules, graphics examples, statistical modules, and the IBM SPSS Statistics Smartreader for IBM SPSS Statistics
Category: Software Development / Misc. Programming
Publisher: SPSS, an IBM Company, License: Shareware, Price: USD $0.00, File Size: 16.7 MB
Platform: Windows
StaTool is a Windows application for Statistics and Probability calculations.
StaTool is a Windows application for Statistics and Probability calculations.
StaTool performs 7 types of Statistics and Probability calculations: Hypothesis testing, Confidence interval estimation, Probability distributions, One variable Statistics, Two variables Statistics, Total Probability Law and Bayes' Theorem, Probability of A and B events.
Category: Business & Finance / Calculators
Publisher: VaxaSoftware, License: Demo, Price: USD $15.00, File Size: 2.2 MB
Platform: Windows
The GoVisual Diagram editor (GDE) provides powerful functionality for Editing and automatic layout of diagrams. Diagrams are represented in form of graphs and cluster graphs. GDE contains all the layout styles available in the GoVisual libraries. he screenshot shows GDE's main window with several open document windows. The active document windows shows a cluster Graph with...
Category: Business & Finance / MS Office Addons
Publisher: OREAS GmbH, License: Freeware, Price: USD $0.00, File Size: 3.0 MB
Platform: Windows
Cumulative Probability Plot does all of the statistical mathematics for you and outputs the data in a visual format that can be easily interpreted by people with a limited knowledge of Statistics.
The Graph is also useful for a quick demonstration to regulators or other interested parties that your product or process is within acceptable tolerance or meets regulatory...
Category: Multimedia & Design / Multimedia App's
Publisher: Rad Pro Calculator, License: Freeware, Price: USD $0.00, File Size: 8.8 MB
Platform: Windows
Cricket Statz Pro is the most advanced cricket Statistics software available to those that are serious about their Statistics.
It is designed to provide an extensive range of Statistics for teams, clubs, associations, statisticians and individuals. Simply enter scorecard details and Cricket Statz Pro will produce professional reports and graphs.
Category: Utilities / Misc. Utilities
Publisher: Red Axe Software, License: Shareware, Price: USD $0.00, File Size: 0
Platform: Windows


