Free Downloads: Graph Functions
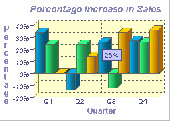
2D / 3D Area Graph provides both a client and server side solution for the incorporation of area graphs into web pages. It provides versatile components so that web authors and Java developers can easily build and publish dynamic and interactive area graphs. With many configurable features and Functions to both applet and servlet, the documentation and examples are designed to...
Category: Business & Finance
Publisher: Sirius Computer Consultants Limited, License: Shareware, Price: USD $49.00, File Size: 212.6 KB
Platform: Windows, Linux, OS/2, Mac, Unix, MS-DOS
Visual Calculus is a grapher to compute and Graph limit, derivative, integral, 3D vector, partial derivative function, series, ODE etc.Pre-calculus: Functions, piecewise defined function, even and odd Functions, polynomials, rational Functions.The program has the Ability to set and modify the properties of coordinate graphs, animations and table graphs.Also the...
Category: Home & Education / Mathematics
Publisher: GraphNow Software, License: Shareware, Price: USD $60.00, File Size: 3.4 MB
Platform: Windows
The WebViewer plug-in enables Windows users whether or not they have SigmaPlot to explore the data used to create the Graph.
Using the WebViewer plug-in with your Web browser window you can:
- View the data used to create the Graph
- Print a Graph in a web document at full resolution
- Zoom in and out of a Graph
- Grab and...
Category: Multimedia & Design / Graphics Viewers
Publisher: SYSTAT Software Inc., License: Freeware, Price: USD $0.00, File Size: 12.6 MB
Platform: Windows
With The Option Strategy Builder you could pick up an option and place it directly to the return Graph. As with the online tool, just drag and drop the option on the Graph, and build your strategy. Using your mouse, the options can be easily moved on the Graph to different strike prices, and to different expiration dates.
With this program you can manage your...
Category: Multimedia & Design / Multimedia App's
Publisher: SamoaSky, License: Freeware, Price: USD $0.00, File Size: 3.1 MB
Platform: Windows
Archimedes Grapher is a kind of powerful and convenient tool software which supports functional Graph plotting, numerical calculation, unit conversion, and slide show. It can plot all kinds of graphs (functional graphs, table graphs, polar equation, parameter equation, inequation and etc.), implement all kinds of calculations (multivariable scientific calculation, generating numerical...
Category: Home & Education / Miscellaneous
Publisher: NewXor Software,Inc, License: Shareware, Price: USD $28.00, File Size: 2.1 MB
Platform: Windows
Audio Graph ActiveX is an ActiveX (OCX) component for software developers. With this ActiveX component you can display a meter, detect a silence, and display 2 types of audio graphs by the WaveIn/WaveOut buffers. Just send a pointer of the buffers array to the component then operate the Display function, the component will do the rest on the Graph view. You can set the...
Category: Software Development
Publisher: expresslib.com, License: Shareware, Price: USD $69.00, File Size: 806.5 KB
Platform: Windows
ImageDIG consists of three integrated modules which allow the user to convert 2D flat images into 3D (x,y,z) data or if a Graph, convert the Graph in image form into 2 dimensional numerical data. The third module is a full analysis plotting utility where the user can import either the 2D or 3D data saved above or import any number of columns of data from a file. The data can then...
Category: Business & Finance / Applications
Publisher: SciCepts Engineering, License: Shareware, Price: USD $49.95, File Size: 0
Platform: Windows
Graph-A-Ping allows you to visually see the ping latency between ping times.
Graph-A-Ping allows you to visually see the ping latency between ping times. The bigger the gap between one ping to another allows you to spot possible network bottle neck.
This tool is actually an applet part of Glass Net Networks monitoring console.
Category: Internet / Misc. Plugins
Publisher: Mataluis.Com, License: Freeware, Price: USD $0.00, File Size: 2.1 MB
Platform: Windows
STFMath, technically enhanced math utility, allows you to: draw Cartesian (standard or parametric) and Polar Functions, special Functions (Gamma,Beta,Fourier, Blancmange) or Integral (with Average preview) in MDI (Multi Documents Interface) supported Graph Mode (open up to 10 independent Graph documents in the same window).
Category: Home & Education / Mathematics
Publisher: Slavko Ilic, License: Shareware, Price: USD $24.00, File Size: 4.2 MB
Platform: Unknown
XYZ Data Viewer is a Excel table to 3-D graph converter.
XYZ Data Viewer is a Excel table to 3-D Graph converter. It provide easy way to analyze a variety of tabular data from Microsoft Excel in the view of 3-dimensions Graph. With this tool You can view and examine your data as a three-dimensional object in three-dimensional space, by manipulate the 3d object on the program screen. You can save this 3d Graph as a file and upload...
Category: Multimedia & Design / Media Management
Publisher: 3 Fish Software, License: Shareware, Price: USD $69.95, File Size: 9.1 MB
Platform: Windows
a powerful, easy-to-use, equation plotter with numerical and calculus features: - Graph Cartesian Functions, relations, and inequalities, plus polar, parametric, and ordinary differential equations. - Up to 999 graphs on screen at once. - New data plotting and curve-fitting features. - Numerically solve and graphically display tangent lines and integrals. - Find critical points,...
Category: Home & Education / Miscellaneous
Publisher: kSoft, Inc., License: Shareware, Price: USD $25.00, File Size: 374.0 KB
Platform: Windows
dcsDigitiser, a Graph digitizer and densitometer, converts graphs into digital X-Y numerical numbers for peer analysis of graphs and gel in the open literature and/or of your own hard copies. With excellent performance, dcsDigitiser is accurate, precise, versatile and straightforward in its use. It is now only a few clicks to get a numerical reading of graphs of interest while surfing on...
Category: Home & Education / Mathematics
Publisher: J & C Consultation and Technology, License: Shareware, Price: USD $120.00, File Size: 3.8 MB
Platform: Windows
This 2D / 3D Stacked Vertical Bar Graph provides both a client and server side solution for the incorporation of bar graphs into web pages. It provides versatile components so that web authors and Java developers can easily build and publish dynamic and interactive bar graphs. We have built in many configurable features and Functions to both the applet and servlet and as such, the...
Category: Multimedia & Design / Multimedia App's
Publisher: Sirius Computer Consultants Limited, License: Shareware, Price: USD $49.95, File Size: 214.0 KB
Platform: Windows
This 3D Vertical Bar Graph provides both a client and server side solution for the incorporation of bar graphs into web pages. It provides versatile components so that web authors and Java developers can easily build and publish dynamic and interactive bar graphs. We have built in many configurable features and Functions to both the applet and servlet and as such, the...
Category: Business & Finance
Publisher: Sirius Computer Consultants Limited, License: Shareware, Price: USD $49.00, File Size: 273.2 KB
Platform: Windows, Linux, OS/2, Mac, Unix
aiSee reads a textual, easy-to-read and easy-to-learn Graph specification and automatically calculates a customizable Graph layout. This layout is then displayed, and can be interactively explored, printed and exported to various graphic formats.
See has been optimized to handle huge graphs automatically generated by applications. It is available for Windows, Linux, and Mac...
Category: Home & Education / Miscellaneous
Publisher: Ai-See, License: Shareware, Price: USD $395.00, File Size: 18.2 MB
Platform: Windows
Powerful but easy-to-use graphing, curve fitting and calculating software. Graphs Cartesian (Y(x) and X(y)), polar and parametric Functions, graphs of tables, equations (implicit Functions), inequalities and slope fields. Up to 100 graphs in one window. Calculus features: regression analysis, obtaining zeroes and extrema of Functions, intersections, derivatives, equations...
Category: Home & Education
Publisher: Alentum Software, Inc., License: Shareware, Price: USD $29.95, File Size: 1.1 MB
Platform: Windows
Fotoview Graphing is an easy to use program for drawing and exploring graphs of mathematical Functions and their derivatives. Functions can be entered by typing on the keyboard or by pressing the function buttons on the screen with the mouse. You can zoom in and out and move the Graph around in a flexible way. You can also open, save and print the graphs and...
Category: Multimedia & Design / Multimedia App's
Publisher: Fotoview, License: Shareware, Price: USD $0.00, File Size: 6.3 MB
Platform: Windows
Graph Extract is a program for digitizing plots.
Graph Extract is a program for digitizing plots. Using either manual or automated approaches, this program provides a means to easily extract numeric data from plots. The resulting X-Y data can be printed or replotted, or it can be saved in Excel file for
Category: Multimedia & Design
Publisher: quadtechassociates.com, License: Freeware, Price: USD $0.00, File Size: 446.0 KB
Platform: Windows
CoGui is a free Graph-based visual tool, developed in Java, for building Conceptual Graph knowledge bases represented in COGXML format, compatible with Cogitant.
Category: Multimedia & Design / Video
Features:
- Intuitive visual structures for building real-world knowledge bases
- Reasoning capabilities with Cogitant
- XML persistent storage
Functionalities:
Publisher: LIRMM, License: Shareware, Price: USD $0.00, File Size: 0
Platform: Windows
LAB Fit is a software for Windows developed for treatment and analysis of experimental data.
LAB Fit is a software for Windows developed for treatment and analysis of experimental data. At LABFit program you are able to:
1) Treat similar data (grouped and ungrouped dataset, one or two samples);
2) Treat non-similar data;
3) Determine propagated error (error propagation up to eight independent variables);
4) Plot 2D and 3D Graph (normal, parametric, imported...
Category: Home & Education / Science
Publisher: Wilton Pereira da Silva, License: Shareware, Price: USD $60.00, File Size: 3.3 MB
Platform: Windows
Graph visualization is a way of representing structural information as diagrams of abstract graphs and networks. Automatic Graph drawing has many important applications in software engineering, database and web design, networking, and in visual interfaces
Category: Multimedia & Design
Publisher: graphviz.org, License: Freeware, Price: USD $0.00, File Size: 26.6 MB
Platform: Windows, Mac, Vista
Fly-through 3D graph software for exciting presentations, marketing, sales, analysis and fun!
Fly-through 3D Graph software for exciting presentations, marketing, sales, analysis and fun! Capture the attention of your audience with spectacular 3D technology. Instead of showing your audience another boring line Graph, capture their interest with something wildly different. They will be more likely to talk about and remember your presentation that had something that stood...
Category: Business & Finance
Publisher: Swan Studios, License: Shareware, Price: USD $39.95, File Size: 8.5 MB
Platform: Windows
Graphe Easy is a feature-rich yet easy-to-use 2d-graph plotting Windows software.
Graphe Easy is a feature-rich yet easy-to-use 2d-Graph plotting Windows software. It allows to draw many Graph types (cartesian, polar, parametric coordinates) and many other graphs such as conics, integrals, inequations or sequences. It also provides a wide range of tools to comment on the graphics and get high quality results.
Category: Utilities / System Utilities
Publisher: Olivier ANSQUER, License: Shareware, Price: USD $39.00, File Size: 4.2 MB
Platform: Windows
To succeed in mathematics, one must be able to solve the problems.
To succeed in mathematics, one must be able to solve the problems. MathXpert can help you learn to solve the problems in your mathematics course.
MathXpert was designed to replace blackboards and homework, not teachers and books.
When you press the Graph button, you immediately get a Graph of the expression or equation in the current calculation. MathXpert will choose...
Category: Home & Education / Mathematics
Publisher: Michael Beeson, License: Shareware, Price: USD $89.95, File Size: 15.5 MB
Platform: Windows
Graphing Calculator is a tool for quickly visualizing math.
Graphing Calculator is a tool for quickly visualizing math. You type an equation and Graphing Calculator draws it for you without complicated dialogs or commands.
Graph Functions in two, three, and four dimensions, explicit, implicit, or parametric. Graph inequalities, contour plots, density plots and vector fields. Use rectangular, polar, cylindrical, or...
Category: Business & Finance / Applications
Publisher: Pacific Tech, License: Shareware, Price: USD $20.00, File Size: 3.1 MB
Platform: Windows

