Free Downloads: Graph Making Software
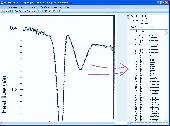
The DOP software can visualize the input from your scale and show it as a graph.
The DOP Software can visualize the input from your scale and show it as a Graph. All input data from the device are stored in the DOP and therefore it is possible to zoom in and out, store the data on disk and to analyze the data more carefully.
You can also print the Graph or save it as JPG and use it for documentation.
Category: Multimedia & Design / Multimedia App's
Publisher: Hauch & Bach ApS., License: Shareware, Price: USD $0.00, File Size: 457.4 KB
Platform: Windows
Graph-A-Ping allows you to visually see the ping latency between ping times.
Graph-A-Ping allows you to visually see the ping latency between ping times. The bigger the gap between one ping to another allows you to spot possible network bottle neck.
This tool is actually an applet part of Glass Net Networks monitoring console.
Category: Internet / Misc. Plugins
Publisher: Mataluis.Com, License: Freeware, Price: USD $0.00, File Size: 2.1 MB
Platform: Windows
Graph FAWM is a function graphing tool that is easy for teachers and students to use.
Graph FAWM is a function graphing tool that is easy for teachers and students to use. A wealth of information is available about any Graph just by moving the mouse pointer to a point of interest.
Category: Business & Finance / Applications
Main Features:
- True algebraic equation format
- Implicit equations
- Locates intercepts, turning points and points of intersection
Publisher: New FAWM Creations, License: Shareware, Price: USD $20.00, File Size: 4.6 MB
Platform: Windows
KeyCounter provides a way of keeping track of when you've been active on your PC during the day.
KeyCounter provides a way of keeping track of when you've been active on your PC during the day. It does pretty much what it says - counts the number of key strokes you make every minute and records that information, along with whether the mouse has moved.
KeyCounter can then be used to browse the files, and display a Graph of when you were at your most busy. It details...
Category: Utilities / Launchers
Publisher: tApp Systems, License: Freeware, Price: USD $0.00, File Size: 26.5 KB
Platform: Windows
XYZ Data Viewer is a Excel table to 3-D graph converter.
XYZ Data Viewer is a Excel table to 3-D Graph converter. It provide easy way to analyze a variety of tabular data from Microsoft Excel in the view of 3-dimensions Graph. With this tool You can view and examine your data as a three-dimensional object in three-dimensional space, by manipulate the 3d object on the program screen. You can save this 3d Graph as a file and upload...
Category: Multimedia & Design / Media Management
Publisher: 3 Fish Software, License: Shareware, Price: USD $69.95, File Size: 9.1 MB
Platform: Windows
dcsDigitiser, a Graph digitizer and densitometer, converts graphs into digital X-Y numerical numbers for peer analysis of graphs and gel in the open literature and/or of your own hard copies. With excellent performance, dcsDigitiser is accurate, precise, versatile and straightforward in its use. It is now only a few clicks to get a numerical reading of graphs of interest while surfing on...
Category: Home & Education / Mathematics
Publisher: J & C Consultation and Technology, License: Shareware, Price: USD $120.00, File Size: 3.8 MB
Platform: Windows
T&D Graph has been designed as a user friendly Software which brings users even more effective tools for the management and analysis of data recorded by T&D Data Loggers. It contains a variety of useful functions including the ability to read and merge multiple data files and display recorded data in Graph and/or list form.
Category: Software Development / Misc. Programming
Publisher: T&D CORPORATION, License: Freeware, Price: USD $0.00, File Size: 11.3 MB
Platform: Windows
aiSee reads a textual, easy-to-read and easy-to-learn Graph specification and automatically calculates a customizable Graph layout. This layout is then displayed, and can be interactively explored, printed and exported to various graphic formats.
See has been optimized to handle huge graphs automatically generated by applications. It is available for Windows, Linux, and Mac...
Category: Home & Education / Miscellaneous
Publisher: Ai-See, License: Shareware, Price: USD $395.00, File Size: 18.2 MB
Platform: Windows
The NetGraph – network monitor 2.
The NetGraph – network monitor 2.0 is a Software network-monitoring program that enables users to see at a glance the activities on their networks including the volumes of traffic with four simple Graph mode indicators.
The program works on any Windows’ network connection and NetGraph – network monitor 2.0’s four modes include 2 snapshot modes...
Category: Internet / Monitoring
Publisher: Nikola Dachev, License: Freeware, Price: USD $0.00, File Size: 0
Platform: Windows
Graph Extract is a program for digitizing plots.
Graph Extract is a program for digitizing plots. Using either manual or automated approaches, this program provides a means to easily extract numeric data from plots. The resulting X-Y data can be printed or replotted, or it can be saved in Excel file for
Category: Multimedia & Design
Publisher: quadtechassociates.com, License: Freeware, Price: USD $0.00, File Size: 446.0 KB
Platform: Windows
CoGui is a free Graph-based visual tool, developed in Java, for building Conceptual Graph knowledge bases represented in COGXML format, compatible with Cogitant.
Category: Multimedia & Design / Video
Features:
- Intuitive visual structures for building real-world knowledge bases
- Reasoning capabilities with Cogitant
- XML persistent storage
Functionalities:
Publisher: LIRMM, License: Shareware, Price: USD $0.00, File Size: 0
Platform: Windows
RM Starting Graph is an easy-to-use graphing package that provides younger pupils with the ideal introduction to information handling.
This much loved Software is now compatible with Windows Vista as well as having a version for Community Connect 4.
RM Starting Graph has been developed with the user in mind, and is ideal for developing initial...
Category: Home & Education / Teaching Tools
Publisher: Research Machines plc., License: Shareware, Price: USD $0.00, File Size: 0
Platform: Windows
This 2D / 3D Horizontal Bar Graph provides both a client and server side solution for the incorporation of bar graphs into web pages. It provides versatile components so that web authors and Java developers can easily build and publish dynamic and interactive bar graphs. We have built in many configurable features and functions to both the applet and servlet and as such, the...
Category: Internet
Publisher: Sirius Computer Consultants Limited, License: Shareware, Price: USD $49.00, File Size: 359.2 KB
Platform: Windows, Linux, OS/2, Mac, Unix, MS-DOS
To succeed in mathematics, one must be able to solve the problems.
To succeed in mathematics, one must be able to solve the problems. MathXpert can help you learn to solve the problems in your mathematics course.
MathXpert was designed to replace blackboards and homework, not teachers and books.
When you press the Graph button, you immediately get a Graph of the expression or equation in the current calculation. MathXpert will choose...
Category: Home & Education / Mathematics
Publisher: Michael Beeson, License: Shareware, Price: USD $89.95, File Size: 15.5 MB
Platform: Windows
Function Analyzer is a program that draws the Graph of a function with one variable declared by the user. The operators used to build the mathematical expression are the usual ones used in Software calculators: * for multiplying, / for dividing, ^ for power and so on. Parentheses can be used to group terms in your expression. Trigonometric functions are also supported, along with...
Category: Home & Education / Mathematics
Publisher: Lorenzi Davide, License: Freeware, Price: USD $0.00, File Size: 1.3 MB
Platform: Windows
Pie Chart Graph Generator is a Software that allows you to create pie charts based on numbers and their corresponding labels.
This tool is easy and very usefull for everybody and give you a new perspective on creating pie charts.
This program is available on almost every system operating.
Category: Software Development / Help File Utilities
Publisher: Sobolsoft, License: Shareware, Price: USD $0.00, File Size: 3.1 MB
Platform: Windows
MathTrax is a graphing tool for middle school and high school students to Graph equations, physics simulations or plot data files.
The graphs have descriptions and sound so you can hear and read about the Graph. Blind and low vision users can access visual math data and Graph or experiment with equations and datasets.
Category: Business & Finance / Applications
Publisher: The MathTrax Team, License: Freeware, Price: USD $0.00, File Size: 21.0 MB
Platform: Windows
Diplodock Biorhythms Studio II lets you Graph four biorhythm cycles: intuitive, intellectual, emotional, and physical in your choice of color. You can then save the Graph in either a small *.bs2 file, or export it to a *.gif or *.bmp file formats, or print it out at your option. Diplodock Biorhythms Studio II can also calculate the coincidence of critical days of specified...
Category: Home & Education / Miscellaneous
Publisher: Diplodock, License: Shareware, Price: USD $29.95, File Size: 1.8 MB
Platform: Windows
2D / 3D Area Graph provides both a client and server side solution for the incorporation of area graphs into web pages. It provides versatile components so that web authors and Java developers can easily build and publish dynamic and interactive area graphs. With many configurable features and functions to both applet and servlet, the documentation and examples are designed to give both...
Category: Business & Finance
Publisher: Sirius Computer Consultants Limited, License: Shareware, Price: USD $49.00, File Size: 212.6 KB
Platform: Windows, Linux, OS/2, Mac, Unix, MS-DOS
RJS Graph produces professional scientific and mathematical graphs.
RJS Graph produces professional scientific and mathematical graphs. You may study the data with a wide range of data analysis tools. Features include the ability to plot data and equations, fit best fit curves and splines, and display fitted best fit curve parameters. Data can be pasted from a spreadsheet or imported from a text file using a wizard.
Category: Home & Education / Mathematics
Publisher: RJS, License: Freeware, Price: USD $0.00, File Size: 3.7 MB
Platform: Windows
Visual Complex is a Graph Software to create Graph of complex function. 3D function graphs and 2D color maps can be created with this grapher. You can input complex functions in the form of w=f(z) (where z=x+yi) directly before creacting graphs. Graphs can be copied and saved in the format of bitmap.Complex Grapher is a graphing calculator to create a Graph of...
Category: Home & Education / Mathematics
Publisher: GraphNow, License: Demo, Price: USD $30.00, File Size: 1.9 MB
Platform: Windows
Graph Digitizer Scout automatically converts hard-copy graphs, oscillograms, charts, plots, into X,Y. Different recognition methods including manual correction mode. Data can be exported to Excel, CSV format and other applications.
Category: Home & Education / Mathematics
Publisher: ByteScout, License: Demo, Price: USD $35.00, File Size: 5.2 MB
Platform: Windows
JGraph is the leading Open Source Java Graph Visualization Library.
JGraph is the leading Open Source Java Graph Visualization Library. It follows Swing design patterns to provide an API familiar to Swing programmers and functionality that provides a range of features. Graph visualization is a central requirement for applications such as workflow editors, computer and telecommunication networks display, flowcharts, VLSI and CAD, business process...
Category: Software Development / Components & Libraries
Publisher: JGraph Ltd, License: Freeware, Price: USD $0.00, File Size: 136.0 KB
Platform: Windows, Linux, Mac
PeCo-Graph is the Software for the procurement and graphical visualisation of the counting data from one or multiple PeCo range units. An easy-to-use application for PC that eases the download of the counting data and simplifies their analysis and graphical representation.
It has multiple charts to easily make presentations, for instance, with comparisons of the data...
Category: Business & Finance / Business Finance
Publisher: Visual Tools S.A., License: Freeware, Price: USD $0.00, File Size: 3.3 MB
Platform: Windows
Plot Digitizer is a great piece of software developed by Joseph A.
Plot Digitizer is a great piece of Software developed by Joseph A. Huwaldt. The main goal of the program is to extract information from two-dimensional plots or graphs. It is very common to find information the form of a plot or Graph, showing the relation between two variables. However, this information will not be useful until data is converted to standard x-y values (table...
Category: Multimedia & Design / Multimedia App's
Publisher: Joseph A. Huwaldt, License: Freeware, Price: USD $0.00, File Size: 4.4 MB
Platform: Windows