Free Downloads: Graph Plots
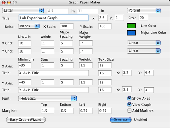
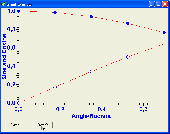
Graph Extract is a program for digitizing plots.
Graph Extract is a program for digitizing Plots. Using either manual or automated approaches, this program provides a means to easily extract numeric data from Plots. The resulting X-Y data can be printed or replotted, or it can be saved in Excel file for
Category: Multimedia & Design
Publisher: quadtechassociates.com, License: Freeware, Price: USD $0.00, File Size: 446.0 KB
Platform: Windows
Graph Digitizer Scout automatically converts hard-copy graphs, oscillograms, charts, Plots, into X,Y. Different recognition methods including manual correction mode. Data can be exported to Excel, CSV format and other applications.
Category: Home & Education / Mathematics
Publisher: ByteScout, License: Demo, Price: USD $35.00, File Size: 5.2 MB
Platform: Windows
Bytescout Graph Digitizer Scout is a handy and useful application that provides users with several functions. This program allows you to convert hard copy graphs, Plots and charts. This efficient software enables you to digitize graphs, charts and Plots using automated methods such as luminosity recognition and color recognition. The program works almost automatically, but...
Category: Multimedia & Design / Multimedia App's
Publisher: ByteScout, License: Shareware, Price: USD $34.45, File Size: 5.2 MB
Platform: Windows
Grapher is the ultimate technical graphing package available.
Grapher is the ultimate technical graphing package available.
Choose from several specialty Graph types, including ternary, box-whisker, bubble Plots, pie charts, and hi-low-close Plots.
Wow your audience every time they see your graphs. Create one of 54 unique Graph types.
This easy-to-use, powerful, dynamic program will...
Category: Multimedia & Design / Multimedia App's
Publisher: Golden Software, License: Shareware, Price: USD $0.00, File Size: 34.0 MB
Platform: Windows
This free program Plots in realtime all data sent and received using the Dial-Up Networking Adapter and Modem. Shows separate sent, received, send rate, received rate, peaks and totals. Five graphs and statistics. Animated System Tray Icon. Allows you to change colours, Graph size, sample seconds, 3D Graph, axis and more. Full automated self-upgrade. Autostart with...
Category: Internet / Dial-up & Connectivity
Publisher: Ashok Kumar Parmar, License: Freeware, Price: USD $0.00, File Size: 819.2 KB
Platform: Windows
Graphing Calculator is a tool for quickly visualizing math.
Graphing Calculator is a tool for quickly visualizing math. You type an equation and Graphing Calculator draws it for you without complicated dialogs or commands.
Graph functions in two, three, and four dimensions, explicit, implicit, or parametric. Graph inequalities, contour Plots, density Plots and vector fields. Use rectangular, polar, cylindrical,...
Category: Business & Finance / Applications
Publisher: Pacific Tech, License: Shareware, Price: USD $20.00, File Size: 3.1 MB
Platform: Windows
Create AutoCAD Plots and Batch Plots faster than ever before with Plot2000!
Create AutoCAD Plots and Batch Plots faster than ever before with Plot2000!
- Supports AutoCAD 2007
- Fast, Consistent Plots
- Speedy Single Plot Macros
- Easy Batch Plots
- Automatic Plot Logging/Billing
- Plot Stamping per your standards
- Easy Network Support with Plot2000 NMS
Category: Multimedia & Design / Image Editing
Publisher: Scott Cook, License: Shareware, Price: USD $79.95, File Size: 3.7 MB
Platform: Windows
DPlot is a general purpose graphing program designed for scientists, engineers, and students. It features multiple scaling types, including linear, logarithmic, and probability scales, as well as several special purpose graphs: tripartite grids (shock spectra), grain size distribution Plots, polar Plots, contour Plots of 3D data, and box-and-whisker Plots and dot...
Category: Multimedia & Design
Publisher: HydeSoft Computing, LLC, License: Shareware, Price: USD $45.00, File Size: 3.9 MB
Platform: Windows
Rt-Plot is a tool to generate Cartesian X/Y-plots from scientific data.
Rt-Plot is a tool to generate Cartesian X/Y-Plots from scientific data. You can enter and calculate tabular data. View the changing graphs, including linear and non linear regression, interpolation, differentiation and integration, during entering. Rt-Plot enables you to create Plots fast and easily. The line calculations give full access to calculation and display ranges and can...
Category: Home & Education / Mathematics
Publisher: Rt-Science, License: Shareware, Price: USD $29.90, File Size: 5.2 MB
Platform: Windows
Plot Digitizer is a great piece of software developed by Joseph A.
Plot Digitizer is a great piece of software developed by Joseph A. Huwaldt. The main goal of the program is to extract information from two-dimensional Plots or graphs. It is very common to find information the form of a plot or Graph, showing the relation between two variables. However, this information will not be useful until data is converted to standard x-y values (table...
Category: Multimedia & Design / Multimedia App's
Publisher: Joseph A. Huwaldt, License: Freeware, Price: USD $0.00, File Size: 4.4 MB
Platform: Windows
Graph plotter program plots 2D graphs from complex equations.
Graph plotter program Plots 2D graphs from complex equations. The application comprises algebraic, trigonometric, hyperbolic and transcendental functions. EqPlot can be used to verify the results of nonlinear regression analysis program. Graphically Review Equations:Equation Graph plotter gives engineers and researchers the power to graphically review equations, by putting...
Category: Home & Education / Mathematics
Publisher: Institute of Mathematics and Statistics, License: Shareware, Price: USD $15.00, File Size: 1.9 MB
Platform: Windows
Also, allows flying. Screen Saver included. .
Category: Home & Education / Mathematics
Publisher: Aepryus, License: Shareware, Price: USD $30.00, File Size: 1.4 KB
Platform: Unknown
Create your own custom sheets of Graph paper. You have complete control over the Graph characteristics. X and Y axis can independently be set for linear or log scale. Selection from a dozen standard paper sizes, or custom create your own. Graphs saved as pdf files you can print them whenever you wish. Choose whatever color you want for the lines. Specify independent line weights...
Category: Home & Education
Publisher: Black Cat Systems, License: Shareware, Price: USD $19.99, File Size: 1.4 MB
Platform: Windows
JFreeChart is a free Java class library for generating charts (GNU LGPL). Support is included for: pie charts, bar charts, line charts, scatter Plots, time series charts, candlestick charts, high-low-open-close charts and more. Use in applications, servlets, JSP or applets. Export to PNG, JPEG, PDF, SVG and HTML image maps. Complete source code is included, subject to the GNU LGPL.
Category: Software Development
Publisher: Object Refinery Limited, License: Freeware, Price: USD $0.00, File Size: 5.3 MB
Platform: Windows, Linux, Unix
Rt-Tools2D is a selection of components to generate two dimensional Cartesian Plots: *TRtCaptionEdit: This is a special edit control supporting enhanced styles as bold, italic, underline, strikeout, subscript, superscript and symbol font. This is especially interesting to alter TRtLabels which supports the same styles. *TRtLabel: Label supporting enhanced styles as bold, italic,...
Category: Software Development
Publisher: Rt-Science, License: Shareware, Price: USD $140.00, File Size: 6.3 MB
Platform: Windows
Graph Studio is the open source graph drawing/processing software.
Graph Studio is the open source Graph drawing/processing software. It allows users to build and process highly customizable graphs.
Category: Multimedia & Design
Publisher: sourceforge.net, License: Freeware, Price: USD $0.00, File Size: 118.0 KB
Platform: Windows, Mac, Vista
Swingpro is a combination software/wireless swing chronograph that can measure swing speed (MPH) and reaction time (hundreds of seconds). Increasing a players swing speed allows for more time to wait-on-a-pitch before you swing. This enables batters to observing the pitch, allowing them to choose better pitches, to recognize the pitch flight pattern, and to establish pitch speed and timing. The...
Category: Audio / Utilities & Plug-Ins
Publisher: Athnetix, License: Shareware, Price: USD $49.99, File Size: 11.0 MB
Platform: Windows
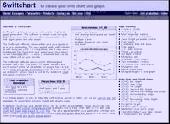
Chart java applet software to generate dynamic charts and graphs - bar, line, pie, stacked and grouped charts in 2D and 3D with a wide range of parameters and chart types. Main features: Charts in 2D/3D, Anti aliasing, Multi language support, Cross browser compatible, Java Script parameter control, Data labels, Contextual data drill down, CSV data sources, Trend calculation, 3D depth control,...
Category: Software Development / Tools & Editors
Publisher: Swiftchart Limited, License: Demo, Price: USD $99.00, File Size: 97.0 KB
Platform: Windows, Mac, Linux, Unix, MS-DOS, AS, 400
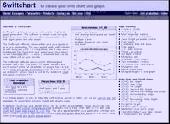
Chart java applet software to generate dynamic charts and graphs - bar, line, pie, stacked and grouped charts in 2D and 3D with a wide range of parameters and chart types. Main features: Charts in 2D/3D, Anti aliasing, Multi language support, Cross browser compatible, Java Script parameter control, Data labels, Contextual data drill down, CSV data sources, Trend calculation, 3D depth control,...
Category: Multimedia & Design
Publisher: Swiftchart Limited, License: Demo, Price: USD $99.00, File Size: 97.7 KB
Platform: Windows, Mac, Linux, Unix, MS-DOS, AS/400
Graph constructs, visualizes and modifies graphs as well as calculates measures and layouts.
Graph constructs, visualizes and modifies graphs as well as calculates measures and layouts.
CoSBiLab Graph can construct, visualize and modify graphs as well as calculate measures and layouts. CoSBiLab Graph can import and export data in a variety of formats, among which the reaction network generated by the beta WorkBench.
Category: Multimedia & Design / Multimedia App's
Publisher: CoSBi, License: Freeware, Price: USD $0.00, File Size: 3.1 MB
Platform: Windows
Chart java applet software to generate dynamic charts and graphs within JSP, servlets or java applications - bar, line, pie, stacked and grouped charts in 2D and 3D with a wide range of parameters and chart types. Main features: Charts in 2D/3D, Anti aliasing, Multi language support, Cross browser compatible, Java Script parameter control, Data labels, Contextual data drill down, CSV data...
Category: Software Development
Publisher: Swiftchart Limited, License: Demo, Price: USD $99.00, File Size: 97.7 KB
Platform: Windows, Mac, Linux, Unix, MS-DOS, AS/400
Chart java applet software to generate dynamic charts and graphs within JSP, servlets or java applications - bar, line, pie, stacked and grouped charts in 2D and 3D with a wide range of parameters and chart types. Main features: Charts in 2D/3D, Anti aliasing, Multi language support, Cross browser compatible, Java Script parameter control, Data labels, Contextual data drill down, CSV data...
Category: Software Development / Tools & Editors
Publisher: Swiftchart Limited, License: Demo, Price: USD $99.00, File Size: 97.0 KB
Platform: Windows, Mac, Linux, Unix, MS-DOS, AS, 400
ImageDIG consists of three integrated modules which allow the user to convert 2D flat images into 3D (x,y,z) data or if a Graph, convert the Graph in image form into 2 dimensional numerical data. The third module is a full analysis plotting utility where the user can import either the 2D or 3D data saved above or import any number of columns of data from a file. The data can then...
Category: Business & Finance / Applications
Publisher: SciCepts Engineering, License: Shareware, Price: USD $49.95, File Size: 0
Platform: Windows
DataPlot is a program where you can import your time based data and graph it.
DataPlot is a program where you can import your time based data and Graph it.You can move easily back and forward in user defined time window, allows individual time setting for each Graph, values read directly in Graph by dragging mouse over the curve and much more
Category: Multimedia & Design / Multimedia App's
Publisher: CBIM, License: Freeware, Price: USD $0.00, File Size: 311.0 KB
Platform: Windows
Drawing graphs without the right tool is simply difficult.
Drawing graphs without the right tool is simply difficult. uDraw(Graph) automates this task for you. Find out how uDraw(Graph) creates your flow charts, diagrams, hierarchies or structure visualizations using automatic layout - much faster than with any standard drawing program. With the API, uDraw(Graph) can even be embedded in your own programs as a visualization component.
Category: Multimedia & Design / Image Editing
Publisher: University Bremen, FB3, Germany, License: Freeware, Price: USD $0.00, File Size: 2.6 MB
Platform: Windows


