Free Downloads: Graphs Of A Function
Software for Determining Balanced Graphs is a free software.
Software for Determining Balanced Graphs is a free software.
A computational method for determining wheether a given graph with weights on the vertices, is balanced so that it can be associated as an invariant, folds maps of closed surface in the plane, the sphere and the projective plane.
Category: Business & Finance / Applications
Publisher: Jeferson Coelho, P. David Romero and C. Mendes Jesus, License: Freeware, Price: USD $0.00, File Size: 1012 B
Platform: Windows
Free Daily Thoroughbred Handicapping Graphs available for all tracks running.
Free Daily Thoroughbred Handicapping Graphs available for all tracks running.. Designed using a 2 million-line database. A7 is simplest, fastest software ever created. A single click prints the Graphs an entire card. No charge. Nothing to buy. FREE expert analysis available everyday. Even children can pick winners using this FREE software. From the 15 year leader in thoroughbred...
Category: Utilities / System Utilities
Publisher: RaceCom, Inc, License: Freeware, Price: USD $0.00, File Size: 1.9 MB
Platform: Windows
This program analyses the results of fieldwork on fluvial geomorphology, and produces Graphs of the results. The data can also be exported as text or simple tables. These Graphs may be printed or
Category: Business & Finance / Applications
Publisher: Amplesoft, License: Shareware, Price: USD $39.82, File Size: 2.9 MB
Platform: Windows
Bytescout Graph Digitizer Scout is a handy and useful application that provides users with several functions. This program allows you to convert hard copy Graphs, plots and charts. This efficient software enables you to digitize Graphs, charts and plots using automated methods such as luminosity recognition and color recognition. The program works almost automatically, but you can...
Category: Multimedia & Design / Multimedia App's
Publisher: ByteScout, License: Shareware, Price: USD $34.45, File Size: 5.2 MB
Platform: Windows
profit and loss and balance sheets.
profit and loss and balance sheets.
? There is also automatic creation of all the Graphs so that you can produce an easy to understand representation of your projections.
Business Plan report
? Our word processing program automatically creates the chapter headings and a contents page. The user just enters the required information for each chapter or pastes it direct...
Category: Business & Finance / Project Management
Publisher: EBP, License: Demo, Price: USD $89.00, File Size: 4.0 MB
Platform: Windows
TI InterActive! brings the power of TI graphing calculators to your computer, including significant functionality.
Main Features:
Function Graphing
- Parametric Graphing
- Polar Graphing
- Zoom, trace and perform interactive calculations on Graphs
- Function Table
- Math, Angle and Test Operations
- Matrix Editor & Matrix...
Category: Business & Finance / Calculators
Publisher: Texas Instruments Inc., License: Shareware, Price: USD $50.00, File Size: 22.3 MB
Platform: Windows
UNaSCANaIT digitizer software works with most image formats (TIFF, JPG, BMP, GIF, etc.
UNaSCANaIT digitizer software works with most image formats (TIFF, JPG, BMP, GIF, etc.) from any scanner, digital camera, or other image source to digitize plots, strip charts, instrumental output, old Graphs, published Graphs, etc. In addition to the many graph digitizing features, UNaSCANaIT also integrates peak areas, smoothes data, takes derivatives, reascales...
Category: Multimedia & Design / Multimedia App's
Publisher: Silk Scientific, Inc., License: Shareware, Price: USD $445.00, File Size: 12.7 MB
Platform: Windows
Graph constructs, visualizes and modifies graphs as well as calculates measures and layouts.
Graph constructs, visualizes and modifies Graphs as well as calculates measures and layouts.
CoSBiLab Graph can construct, visualize and modify Graphs as well as calculate measures and layouts. CoSBiLab Graph can import and export data in a variety of formats, among which the reaction network generated by the beta WorkBench.
Category: Multimedia & Design / Multimedia App's
Publisher: CoSBi, License: Freeware, Price: USD $0.00, File Size: 3.1 MB
Platform: Windows
If you are searching for a computer program that can plot simple Graphs on your PC, GraphSight Junior is what you are looking for. This utility is feature rich and comprehensive. It plots 2D Graphs with easy navigation, and it’s well suited for high school and college math students.
It can plot Cartesian, polar, table defined, as well as specialty Graphs, such...
Category: Home & Education / Mathematics
Publisher: CradleFields.com, License: Freeware, Price: USD $0.00, File Size: 417.5 KB
Platform: Windows
DPLOT95 is a software for creating and manipulating graphs in 1, 2, 3, and 4-D.
DPLOT95 is a software for creating and manipulating Graphs in 1, 2, 3, and 4-D. With its help you you can create presentation-quality Graphs as well as contour plots of 3-D and 4-D data while using data from a variety of sources. You can use multiple scaling types, including linear, logarithmic, and probability scales on the X and/or Y axes. DPlot also provides several special...
Category: Multimedia & Design / Multimedia App's
Publisher: USAERDC, License: Shareware, Price: USD $195.00, File Size: 9.9 MB
Platform: Windows
Mangodata is a powerful yet easy to use multi-user database for education.
Mangodata is a powerful yet easy to use multi-user database for education. It allows pupils to easily create a database, enter information and then search the data to display results through a range of Graphs.
This information might include a class survey, historical census information or perhaps the results of a scientific investigation. There is a ‘live’ link...
Category: Home & Education / Miscellaneous
Publisher: MightyMango, License: Shareware, Price: USD $0.00, File Size: 0
Platform: Windows
Displays graphs of algebraic functions in a variety of forms.
Displays Graphs of algebraic functions in a variety of forms. These include polar and cartesian co-ordinates, parametric and intrinsic functions. A wide range of functions are built-in, from simple trig and hyperbolic functions to things such as the ceil and gamma functions. On-screen HTML help is bulit-in.
Functions can be defined such as
f(x)= 1 + x
These can be of...
Category: Home & Education / Mathematics
Publisher: Walter Milner, License: Freeware, Price: USD $0.00, File Size: 150.0 KB
Platform: Windows
This application renders a number of moving fragments of sine and cosine Graphs, meant to be visually attractive. For Windows XP. The application is designed for use on a modern LCD.
Category: Home & Education / Miscellaneous
Publisher: english.rejbrand.se, License: Freeware, Price: USD $0.00, File Size: 517.0 KB
Platform: Windows
Math tool for high school teachers and students. Function graphing and analyzing: 2D, 2.5D Function Graphs and animations, extrema, root, tangent, limit,derivative, integral, inverse; sequence of number: arithmetic progression, geometric progression; analytic geometry: vector, line, circle, ellipse, hyperbola and parabola; solid geometry: spatial line, prism, pyramid,...
Category: Home & Education / Mathematics
Publisher: GraphNow, License: Shareware, Price: USD $29.95, File Size: 2.3 MB
Platform: Unknown
Draw graphs of how your weight changes over time. .
Draw graphs of how your weight changes over time.
Category: Home & Education
Publisher: Haverton Ltd., License: Shareware, Price: USD $4.99, File Size: 2.1 MB
Platform: Windows
WinADV provides the capability to quickly view time series Graphs, histograms, or FFT's of the various velocity data. Data may be filtered on-the-fly and sampling windows may be established so that only relevant data are plotted. For data collected from moving, or traversing probes, an equation describing the position of the probe as a Function of time may be entered so that...
Category: Home & Education / Science
Publisher: Bureau of Reclamation, License: Freeware, Price: USD $0.00, File Size: 3.2 MB
Platform: Windows
Graph FAWM is a function graphing tool that is easy for teachers and students to use.
Graph FAWM is a Function graphing tool that is easy for teachers and students to use. A wealth of information is available about any graph just by moving the mouse pointer to a point of interest.
Category: Business & Finance / Applications
Main Features:
- True algebraic equation format
- Implicit equations
- Locates intercepts, turning points and points of intersection
Publisher: New FAWM Creations, License: Shareware, Price: USD $20.00, File Size: 4.6 MB
Platform: Windows
Produces stereoscopic graphs of mathematical functions.
Produces stereoscopic Graphs of mathematical functions. It also stereographs approximations to the 1st and 2nd order partial derivatives. Most people are able to view them without any paraphernalia. Stereographs are pairs of stereoscopic Graphs that, when properly viewed, give a true three-dimensional effect. True depth perception is due to binocular vision, and the usual single...
Category: Business & Finance / Personal Finance
Publisher: Numerical Mathematics, License: Shareware, Price: USD $15.00, File Size: 1.6 MB
Platform: Windows
MicroGraphs is a graphing library for .
MicroGraphs is a graphing library for .NET Compact Framework ie PocketPCs and SmartPhonesThe library can generate: - Line Graphs- Bar Graphs- Pie Graphs Graphs are interactive and show data on demand. Important Features :- Easy to code LineGraph, BarGraph and PieGraph- Interactive Graphs showing data on demand- Stylus based events show or hide 'nodal values'...
Category: Software Development / Components & Libraries
Publisher: MakeLogic, License: Commercial, Price: USD $29.99, File Size: 1.2 MB
Platform: Windows,
DigitizeIt digitizes scanned Graphs and charts. Graphs can be loaded in nearly all common image formats (incl. gif,tiff,jpeg,bmp,png,psd,pcx,xbm,xpm,tga,pct) or pasted from the clipboard . Digitizing of line and scatter plots occurs automatically, manual digitizing via mouse clicks is also possible. Data values are transformed to a specified axes system and can be saved in ASCII...
Category: Home & Education
Publisher: Bormisoft, License: Shareware, Price: USD $39.00, File Size: 9.7 MB
Platform: Windows, Linux, Unix, Mac
WildBlue Bandwidth Monitor is a utility for WildBlue Internet customers.
WildBlue Bandwidth Monitor is a utility for WildBlue Internet customers. Log and graph your bandwidth usage with this simple utility.
WildBlue Bandwidth Monitor The WildBlue Bandwidth Monitor automatically grabs and stores your current bandwidth usage every hour, showing only a small WildBlue logo in your system tray. When you open the program, you'll see two simple...
Category: Internet / Monitoring
Publisher: RealityRipple Software, License: Shareware, Price: USD $0.00, File Size: 0
Platform: Windows
SURPH is an analytical tool for estimating survival using release-recapture data as a Function of environmental and experimental effects.
These effects may apply to a population (such as ambient temperature) or an individual (such as body length). SURPH provides flexible modeling capability for selecting the most parsimonious models, and diagnostic reports and Graphs...
Category: Business & Finance / Applications
Publisher: University of Washington, License: Freeware, Price: USD $0.00, File Size: 8.2 MB
Platform: Windows
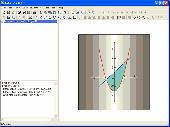
Math tool for linear, nonlinear curve fitting and surface fitting, curve and surface can be created.
Math tool for linear, nonlinear curve fitting and surface fitting. 1. Implement curve fitting and graphing of linear models and nonlinear models. 2. Implement surface fitting and graphing of any binary Function models. 3. 4d data fitting and graphing. 4. Polynomial fitting and graphing. 5. Excel-like data editor is easy to use. 6. Ability to move, zoom in, zoom out and rotate the...
Category: Home & Education / Mathematics
Publisher: GraphNow, License: Shareware, Price: USD $80.00, File Size: 2.4 MB
Platform: Windows
The Plot control created to display graphs and charts on .
The Plot control created to display Graphs and charts on .NET Windows Forms. Advantages of this control are very quick embedding into your application and powerful features. Written using 100% managed code. Also, this control can be used to create animated Graphs. With this control You can: draw lines just from arrays, use gradients to fill lines colors, draw histograms just by...
Category: Software Development / Components & Libraries
Publisher: Advanced Software Solutions, License: Shareware, Price: USD $19.00, File Size: 1.1 MB
Platform: Windows
Insight Graphing allows you to add graphs to your Clarion Windows, or Reports.
Insight Graphing allows you to add Graphs to your Clarion Windows, or Reports. But more importantly than just the ability, it also provides a powerful template interface which allows you to graph data directly out of your files, queues or memory. It also features complete control over the look of your graph, from the axis settings, to the graph itself, even the legend. You control the...
Category: Multimedia & Design / Multimedia App's
Publisher: Capesoft, License: Shareware, Price: USD $349.00, File Size: 968.0 KB
Platform: Windows