Free Downloads: Graphs
MicroGraphs is a graphing library for .
MicroGraphs is a graphing library for .NET Compact Framework ie PocketPCs and SmartPhonesThe library can generate: - Line Graphs- Bar Graphs- Pie Graphs Graphs are interactive and show data on demand. Important Features :- Easy to code LineGraph, BarGraph and PieGraph- Interactive Graphs showing data on demand- Stylus based events show or hide 'nodal values'...
Category: Software Development / Components & Libraries
Publisher: MakeLogic, License: Commercial, Price: USD $29.99, File Size: 1.2 MB
Platform: Windows,
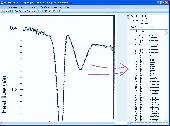
dcsDigitiser, a graph digitizer and densitometer, converts Graphs into digital X-Y numerical numbers for peer analysis of Graphs and gel in the open literature and/or of your own hard copies. With excellent performance, dcsDigitiser is accurate, precise, versatile and straightforward in its use. It is now only a few clicks to get a numerical reading of Graphs of interest...
Category: Home & Education / Mathematics
Publisher: J & C Consultation and Technology, License: Shareware, Price: USD $120.00, File Size: 3.8 MB
Platform: Windows
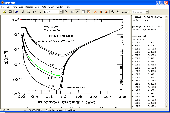
DigitizeIt digitizes scanned Graphs and charts. Graphs can be loaded in nearly all common image formats (incl. gif,tiff,jpeg,bmp,png,psd,pcx,xbm,xpm,tga,pct) or pasted from the clipboard . Digitizing of line and scatter plots occurs automatically, manual digitizing via mouse clicks is also possible. Data values are transformed to a specified axes system and can be saved in ASCII...
Category: Home & Education
Publisher: Bormisoft, License: Shareware, Price: USD $39.00, File Size: 9.7 MB
Platform: Windows, Linux, Unix, Mac
The Plot control created to display graphs and charts on .
The Plot control created to display Graphs and charts on .NET Windows Forms. Advantages of this control are very quick embedding into your application and powerful features. Written using 100% managed code. Also, this control can be used to create animated Graphs. With this control You can: draw lines just from arrays, use gradients to fill lines colors, draw histograms just by...
Category: Software Development / Components & Libraries
Publisher: Advanced Software Solutions, License: Shareware, Price: USD $19.00, File Size: 1.1 MB
Platform: Windows
Distribution Guide is a program allowing to build various graphs of statistical distributions.
Distribution Guide is a program allowing to build various Graphs of statistical distributions. It enables you to enter the parameters of the particular distribution and display the Graphs of such functions as PDF, CDF, and others. Printing support is provided as well.
Supported distributions:
- Exponential
- Lognormal
- Normal
- Weibull
-...
Category: Home & Education / Mathematics
Publisher: MathWave Technologies, License: Freeware, Price: USD $0.00, File Size: 1.1 MB
Platform: Windows
Insight Graphing allows you to add graphs to your Clarion Windows, or Reports.
Insight Graphing allows you to add Graphs to your Clarion Windows, or Reports. But more importantly than just the ability, it also provides a powerful template interface which allows you to graph data directly out of your files, queues or memory. It also features complete control over the look of your graph, from the axis settings, to the graph itself, even the legend. You control the...
Category: Multimedia & Design / Multimedia App's
Publisher: Capesoft, License: Shareware, Price: USD $349.00, File Size: 968.0 KB
Platform: Windows

ActiveX/OCX control to draw 2D pie charts, bar charts & line Graphs. As well as displaying the Graphs they can be exported to file in gif, png, bmp, jpg or pcx format. Output can be exported as binary data for use with web applications, or copied to the clipboard. A comprehensive selection of properties allow control over colours, fonts, formatting and layout. Pie and bar charts...
Category: Software Development
Publisher: Chestysoft, License: Demo, Price: USD $60.00, File Size: 976.3 KB
Platform: Windows
Function Grapher is an easy-to-use software to create 2D, 2.5D, 3D function Graphs, animations and table Graphs. 2D Features: explicit, implicit, parametric, and in equation; Cartesian and polar coordinate systems; curve and animation; graph of inverse function and derivative function; parity; maximum, minimum, and inflexion; integration; root; the length of curve; tangent and...
Category: Home & Education / Mathematics
Publisher: GraphNow, License: Shareware, Price: USD $39.95, File Size: 2.9 MB
Platform: Unknown
MathCalc run with the calculator and graph plotter mode.
MathCalc run with the calculator and graph plotter mode. Within the calculator mode, you can compute mathematical expressions, trigonometric, hyperbolic or logarithmic functions. The entered expressions and functions are saved into formula lists. The program has a handy, easy-to-use formula editor for these lists. Within the plotter mode, you can plot 2D Graphs a few ways: using tabular...
Category: Business & Finance / Calculators
Publisher: YPS software, License: Shareware, Price: USD $24.00, File Size: 1.0 MB
Platform: Windows
Grab It! is a Microsoft Excel based application that digitizes Graphs or charts to obtain the original data. Graphs and charts can have data point values digitized or photos can have angle and distance measurements made. All data is placed directly into Excel for easy re-use. Skewed Graphs are handled automatically (sometimes scanning isn't perfectly straight) as well as...
Category: Business & Finance
Publisher: DataTrend Software Inc, License: Demo, Price: USD $69.95, File Size: 840.1 KB
Platform: Windows
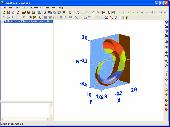
Visual Complex is a graph software to create graphs of complex variable functions.
Visual Complex is a graph software to create Graphs of complex variable functions.
Features:
-Creating 3D Graphs of complex functions
-Creating color maps of complex functions
-Ability to edit graph interactively
-Ability to copy and save graph as bitmap.
Category: Multimedia & Design / Multimedia App's
Publisher: GraphNow Software, License: Shareware, Price: USD $25.00, File Size: 2.0 MB
Platform: Windows
This ASP.NET component draws pie and bar charts and line Graphs "on the fly". Output can be streamed to the browser in GIF or other formats, saved to file or exported to a Bitmap structure. A wide range of properties allow the customisation of colour, size and text style. Built in defaults allow the production of Graphs with only a few lines of code. Show percentages or actual...
Category: Software Development
Publisher: Chestysoft, License: Demo, Price: USD $60.00, File Size: 579.5 KB
Platform: Windows
The HBU is an Hymedis client application that allows you to present the Hymedis information on Graphs and as normal data. Different Hymedis parameters can be presented as Graphs or as updated data.
In different tabs a user can select parameter combinations and, when a connection is established, every minute the latest data is picked up from the central server in Vlissingen....
Category: Multimedia & Design / Multimedia App's
Publisher: HBU, License: Freeware, Price: USD $0.00, File Size: 51.6 MB
Platform: Windows
Grapher is the ultimate technical graphing package available.
Grapher is the ultimate technical graphing package available.
Choose from several specialty graph types, including ternary, box-whisker, bubble plots, pie charts, and hi-low-close plots.
Wow your audience every time they see your Graphs. Create one of 54 unique graph types.
This easy-to-use, powerful, dynamic program will help you create superior...
Category: Multimedia & Design / Multimedia App's
Publisher: Golden Software, License: Shareware, Price: USD $0.00, File Size: 34.0 MB
Platform: Windows
MatheGrafix is an excellent tool that allows you to plot 2D Graphs including linear, geometric, exponential, fractals ones and more. The program operates in two modes: you can introduce the formula and plot the graph or you can draw interactively a geometric function on the graph.
There are two important windows: the "Mode functions" window which is the main one,...
Category: Business & Finance / Applications
Publisher: Roland Hammes, License: Freeware, Price: USD $0.00, File Size: 1.8 MB
Platform: Windows
Angur is the fruit of an experimental research by Angur Research Team(1), which brings XML files to tree node Graphs. Using Angur, a user can visualize the hirarchy of an XML file into tree Graphs and interact, modify and save the data without any XML knowledge. Angur also lets users create XML files from scratch in a completely visual and guided environment. Using Angur, users...
Category: Multimedia & Design / Multimedia App's
Publisher: Dr. Khalil Ibrahim Shihab, Doreen Sim, License: Shareware, Price: USD $0.00, File Size: 6.5 MB
Platform: Windows
Creating Graphs of regular data and irregular data. Creating vertex, grid and surface model, Delaunay triangles, color map, contour plot, vector plot, 3D contour plot, 4D scatter, 4D slice and 4D vector.
Category: Home & Education / Science
Publisher: GraphNow, License: Shareware, Price: USD $59.95, File Size: 2.6 MB
Platform: Unknown
2D / 3D Area Graph provides both a client and server side solution for the incorporation of area Graphs into web pages. It provides versatile components so that web authors and Java developers can easily build and publish dynamic and interactive area Graphs. With many configurable features and functions to both applet and servlet, the documentation and examples are designed to...
Category: Business & Finance
Publisher: Sirius Computer Consultants Limited, License: Shareware, Price: USD $49.00, File Size: 212.6 KB
Platform: Windows, Linux, OS/2, Mac, Unix, MS-DOS
Graphical Analysis 3 arrives as an easy to use program that produces, analyzes and prints Graphs that you make. It’s been a popular product for years and with this third version new features and capabilities are included as well as an updated look.
Graphical Analysis 3 can do a lot of things. Create and print Graphs, data tables, text, FFTs, and histograms. They...
Category: Home & Education / Miscellaneous
Publisher: Vernier Software & Technology, License: Shareware, Price: USD $80.00, File Size: 7.9 MB
Platform: Windows
Measure the response times of servers and create performance graphs.
Measure the response times of servers and create performance Graphs. The text, XML, HTML, SVG and RTF formats are supported. You may also be notified via email, or run any Windows application if an alarm occurs. The Network Supervisor may notify you if a server goes down etc.
Category: Internet / Monitoring
Publisher: MHC, License: Commercial, Price: USD $2495.00, File Size: 1.5 MB
Platform: Windows
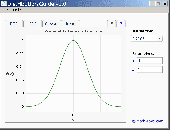
ZGrapher is a simple graphic utility.
ZGrapher is a simple graphic utility. It can be helpful for any user, from a schoolboy to a professional mathematician. Using this program you can plot Graphs of the following types: Y(x), X(y), R(a) – in polar coordinates, X(t) and Y(t) – parametric equations and Graphs of tables. To create a graph you should specify its parameters – formula, graph’s...
Category: Home & Education / Mathematics
Publisher: Palam Software, Inc., License: Freeware, Price: USD $0.00, File Size: 619.8 KB
Platform: Windows
Visual Calculus is a grapher to compute and graph limit, derivative, integral, 3D vector, partial derivative function, series, ODE etc.Pre-calculus: functions, piecewise defined function, even and odd functions, polynomials, rational functions.The program has the Ability to set and modify the properties of coordinate Graphs, animations and table Graphs.Also the ability to move,...
Category: Home & Education / Mathematics
Publisher: GraphNow Software, License: Shareware, Price: USD $60.00, File Size: 3.4 MB
Platform: Windows
This 2D / 3D Stacked Vertical Bar Graph provides both a client and server side solution for the incorporation of bar Graphs into web pages. It provides versatile components so that web authors and Java developers can easily build and publish dynamic and interactive bar Graphs. We have built in many configurable features and functions to both the applet and servlet and as such, the...
Category: Multimedia & Design / Multimedia App's
Publisher: Sirius Computer Consultants Limited, License: Shareware, Price: USD $49.95, File Size: 214.0 KB
Platform: Windows
Web Enabled solution for creating Stacked Horizontal Charts & Graphs.
Web Enabled solution for creating Stacked Horizontal Charts & Graphs. Versatile components for web authors and developers to easily build and publish dynamic and interactive bar Graphs. Database Access Methods (Direct Data Binding and Multi-Tier)Template Scripts and Implementations (ASP, JSP, PHP and Servlet Code)Documentation, Demo Implementations and Tutorial Guides.Dynamic...
Category: Software Development / Tools & Editors
Publisher: Sirius Computer Consultants Limited, License: Shareware, Price: USD $49.95, File Size: 252.0 KB
Platform: Windows
 Demo
Demo
Imagine a complete Graphing solution assisting you right from importing data and manipulating data, plotting Graphs, customizing looks, saving and exporting your Graphs as high quality images and producing dynamic reports of your data in a matter of a few easy steps. Features: Data Import: Connects effortlessly with your MS SQL Server, Oracle, Access, XLS and CSV files...
Category: Software Development / Databases & Networks
Publisher: Teknowledge LLC, License: Demo, Price: USD $99.00, File Size: 8.1 MB
Platform: Windows