Free Downloads: Historical Volatility Stock Charts
This is a free spreadsheet that downloads free Historical Stock data from the Yahoo database and calculates the Historical (realized) Volatility of the selected Stock. The standard deviation of prices are plotted along side the Stock price chart.
Category: Business & Finance / Business Finance
Publisher: optiontradingtips.com, License: Freeware, Price: USD $0.00, File Size: 70.3 KB
Platform: Windows, Mac, 2K, 2K3, Vista
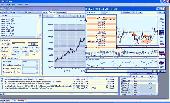
Free Stock Charting Software with historical charts, technical analysis indicators and news.
Free Stock Charting Software with Historical Charts, technical analysis indicators and news. We have taken the open source eclipse trade and cleaned up a version specific to news and Charts with technical analysis.
Category: Business & Finance / Business Finance
Publisher: pennystocknet.com, License: Freeware, Price: USD $0.00, File Size: 26.7 MB
Platform: Windows, Vista
This free software uses 19 intelligent and classic technical analysis methods, new Quotes (delayed 15 minutes) and Historical Quotes to analyze Stock, displays 18 Charts in a window and marks buy/sell signals last 30 days on Charts. It can also display Dow's real time intraday Charts, Stock intraday chart indicators and many good articles about...
Category: Business & Finance / Business Finance
Publisher: Kingsoft, Inc., License: Freeware, Price: USD $0.00, File Size: 1.4 MB
Platform: Windows
All charts are displayed in one window.
All Charts are displayed in one window. User may compare different Charts of one Stock or Charts of different stocks easily.
- Advanced indicators: EquiVolume, Point & Figure, GMMA, Heiken-Ashi, Volatility Stop Loss.
Point & Figure Charts consist of columns of X's and O's that represent filtered price movements over...
Category: Multimedia & Design / Multimedia App's
Publisher: Stock-Anal, License: Shareware, Price: USD $0.00, File Size: 0
Platform: Windows
TurTrades lets you practice Stock market trading, by replaying REAL Historical Stock prices and technical indicators. You can get years of trading experience in few hours, by replaying Stock market data while you practice trading. TurTrades could be also used to look at Historical Charts and prices. It is sort of paper trading in the past and next day...
Category: Business & Finance / Small Business Tools
Publisher: TurTrades, License: Freeware, Price: USD $0.00, File Size: 329.9 KB
Platform: Windows
 Shareware
CharTTool is an advanced Stock charting software that instantly allows you to display several technical Charts of stocks, mutual funds or indices. Intraday and end-of-day Stock charting is available. The list of technical indicators includes Bollinger bands, price channels, moving averages, fast and slow stochastic oscillators, relative strength index, MACD, trading volume...
Category: Business & Finance / Business Finance
Publisher: Ashkon Technology LLC, License: Shareware, Price: USD $39.95, File Size: 1.1 MB
Platform: Windows, Other
Now you can have your own Stock charting analysis tool: System Fibonacci. With System Fibonacci you can create excellent looking Charts. Download Historical prices for free as provided by Yahoo Finance to create sophisticated Charts with candlesticks, lines, price points and even zigzag lines. Two Fibonacci trendlines instead of just one, with retracements and...
Category: Business & Finance
Publisher: Jigaro Software, License: Shareware, Price: USD $5.00, File Size: 565.2 KB
Platform: Windows
Shareware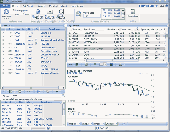
TINYTRADER is a trading software and portfolio manager, that downloads Stock quotes and Charts from Yahoo! Financial international web sites. The program can download intraday, end-of-day and Historical quotes of every ticker managed by Yahoo! Financial web sites (Stock, bonds, mutual funds, ETFs, currency exchange rates, etc.), with automatic currency conversion....
Category: Business & Finance / Applications
Publisher: Antonello Aringhieri, License: Shareware, Price: USD $27.00, EUR20, File Size: 2.0 MB
Platform: Windows
Stock Options Online Indicators.
Stock Options Online Indicators. Implied Volatility, Covered Call Rate, Delta and much more.
Category: Business & Finance / Business Finance
Publisher: optionstradedata.com, License: Freeware, Price: USD $0.00, File Size: 279.0 KB
Platform: Windows, Mac, 2K, 2K3, Vista

Excellent looking Charts with Fibonacci retracemenst, projections, arcs, fans and 2 trends. Download Historical prices for free from Yahoo Finance to create sophisticated Charts. Import any valid financial data csv file including foreing exchange. Several drawing tools, including 2 simultaneous trendlines to automatically calculate the best support and resistance levels....
Category: Business & Finance
Publisher: Jigaro Software, License: Shareware, Price: USD $7.99, File Size: 665.8 KB
Platform: Windows
IT Locus Charting is an advanced charting application for graphical analysis of financial and Stock market.
It supports any number of windows with an arbitrary number of Charts of stocks, futures, mutual funds or indices in each of them.
The list of technical indicators includes moving averages, relative strength index, MACD and others.
The Charts may be saved...
Category: Business & Finance / Business Finance
Publisher: ITLocus.com, License: Commercial, Price: USD $9.99, File Size: 9.8 MB
Platform: Windows, Linux, Mac
EquityRider is an advanced Stock charting and trading systems analysis software for many markets: stocks, forex, and futures. It allows you to create custom indicators, derive indicators based on standard ones, and plot them on Charts Real-Time or Historical. Test custom trading strategies on up to 30 years of Historical data. Monitor your portfolio for BUY/SELL...
Category: Business & Finance
Publisher: Equity Rider Trading Inc., License: Shareware, Price: USD $25.99, File Size: 1.0 MB
Platform: Windows
The Stock Investment Guide (SIG)™ is a powerful tool for performing comprehensive fundamental Stock analysis of publicly traded companies. The Stock Investment Guide provides users with easy-to-use tools to use Historical Stock data to analyze Historical growth trends, project earnings, and sales, and determine Buy, Hold, and Sell prices.
Category: Business & Finance / Business Finance
Publisher: Churr Software, License: Shareware, Price: USD $80.00, File Size: 5.4 MB
Platform: Windows
Visual Stock Options Analyzer (VOptions) is a powerful analysis tool for development, testing, and application of Stock and options strategies. Its easy-to-use interface allows you to test new strategies, manage a growing portfolio, and explore "what-if" scenarios with ease. VOptions versatility and power make it suitable for new, experienced, or advanced traders alike....
Category: Business & Finance
Publisher: OLSOFT, License: Shareware, Price: USD $69.95, File Size: 3.0 MB
Platform: Windows
Tool to easily follow the stock market using Point and Figure charts.
Tool to easily follow the Stock market using Point and Figure Charts. Get a set of updated Charts everyday in your mailbox (or if you prefer download the Charts files from our website) We have Charts of the following markets: US US mutual funds, ETF's and iShares Canada United Kingdom Europe Australia Select stocks in minutes with our 'Buy the Winner' view!...
Category: Business & Finance / Applications
Publisher: Magic Potion, License: Demo, Price: USD $49.00, File Size: 7.6 MB
Platform: Windows,
Demo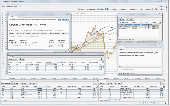
Stockdance is an easy to use Stock investing software for individual investors analyzing companies based on their fundamentals. With Stockdance you can analyze Historical financial data series of a company in a powerful analysis chart and compare the data series with competitors or market indexes. Rate each company based on your Stock selection criterion to select only...
Category: Business & Finance / Business Finance
Publisher: The Green Meadow Company, License: Demo, Price: USD $26.00, File Size: 81.6 MB
Platform: Windows
Stock Chart Wizard downloads freely available Stock market data on individual stocks and displays technical Charts and indicators. You enter in the Stock tickers you wish to
analyze, and within seconds, line or bar Charts are displayed along with selected moving averages and indicators.
Category: Business & Finance / MS Office Addons
Publisher: stockchartwizard.com, License: Shareware, Price: USD $19.00, File Size: 0
Platform: Windows
With QuoteStocker you can download stock prices of almost every stock exchange in the world.
With QuoteStocker you can download Stock prices of almost every Stock exchange in the world. From the Stock quotes of the Dow Jones to the quotes of the Stock exchange in Brasil. With just a few clicks you make your choice and start downloading (Historical) quotes of a Stock, mutual fund, index, currency or future. Once you have downloaded your quotes,...
Category: Business & Finance / Business Finance
Publisher: Vink System Design & Analysis, License: Shareware, Price: USD $29.50, File Size: 912.8 KB
Platform: Windows
Covered Calls Plus Stock Option Trading Software - Take advantage of high Volatility by writing Covered Calls.
Features :
- Instantaneous option symbol roots and cycles for any listed option, ETF, and HOLDRS*.
- Fine tune establishing, rolling, adding to, or closing a covered Call position, with or without protective Puts.
- Compare potential...
Category: Business & Finance / Business Finance
Publisher: Mark Hutchinson, License: Shareware, Price: USD $49.00, File Size: 3.4 MB
Platform: Windows
Incredible Charts Pro is a stock market analysis and charting software.
Incredible Charts Pro is a Stock market analysis and charting software. It is very helpful for all those persons who invest in the big Stock markets of the world whether he is a small investor or a big player of this game. It directly connects to the Stock markets data provider companies. By using this incredible software you can view the last 11 years history of...
Category: Business & Finance / Business Finance
Publisher: Vizhon Corporation, License: Shareware, Price: USD $0.00, File Size: 0
Platform: Windows
RealtimeStockreader shows you the intraday charts of your stock symbols.
RealtimeStockreader shows you the intraday Charts of your Stock symbols. These Charts are being updated every minute (the updating interval can be configured).
RealtimeStockreader alerts you (acoustically) when stocks have reached limits. You can specify lower (STOP LOSS) and upper limits.
Category: Business & Finance / Business Finance
Publisher: realtimestockreader, License: Freeware, Price: USD $0.00, File Size: 69.6 KB
Platform: Windows

The ICS Free Financial Toolbar puts financial search, Stock quotes, Charts, SEC filings, Stock news, and financial audio commentary at your fingertips! It installs in Microsoft Internet Explorer in seconds and includes a free popup blocker, Google and Yahoo Search engines. You'll have instant access to the finest Charts and Stock tools on the web, including...
Category: Business & Finance / Personal Finance
Publisher: Ice Cold Stocks, License: Freeware, Price: USD $0.00, File Size: 975.5 KB
Platform: Windows
Freeware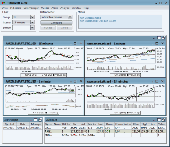
Stock charting and technical analysis software with a user-friendly interface targeted for Stock investors and realtime traders. Supported dataproviders are Yahoo and Interactive Brokers. With the easy to use script language, you can create your own backtests, indicators, screener, real-time alerts and drawing tools! While you are backtesting, TickInvest creates a history of your...
Category: Business & Finance / Applications
Publisher: Erich Behmen, License: Freeware, Price: USD $0.00, File Size: 25.9 MB
Platform: Windows
Freeware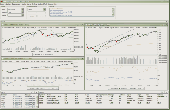
Stock charting and technical analysis software with a user-friendly interface targeted for Stock investors and realtime traders. Supported dataproviders are Yahoo and Interactive Brokers.With the easy to use script language, you can create your own backtests, indicators, screener, real-time alerts and drawing tools! While you are backtesting, TickInvest creates a history of your...
Category: Business & Finance / Business Finance
Publisher: Erich Behmen, License: Freeware, Price: USD $0.00, File Size: 27.4 MB
Platform: Windows
Have you ever seen a Stock chart and wondered what made the Stock shoot up like a rocket or drop like a rock? Stock Spy is unlike any other Stock chart because it helps explain what you're seeing. It clearly displays the news and company events which cause the price movements - directly on the chart. Stock Spy shows you relationship the between Stock...
Category: Business & Finance / Project Management
Publisher: Stock RSS News Alerts, License: Demo, Price: USD $39.95, File Size: 3.2 MB
Platform: Windows