Free Downloads: Html Bar Range Graphs
An utility to track network usage, showing actual vertical Bar Graphs for both download and upload byte amounts. It lets you determine if a download failed or if it has finished (no download activity). It is also useful for detecting at a glance if someone's stealing files and documents from your computer (unexpected upload activity).
Category: Internet / Monitoring
Publisher: Daniele Giabbai, License: Freeware, Price: USD $0.00, File Size: 1.7 MB
Platform: Windows
Mangodata is a powerful yet easy to use multi-user database for education.
Mangodata is a powerful yet easy to use multi-user database for education. It allows pupils to easily create a database, enter information and then search the data to display results through a Range of Graphs.
This information might include a class survey, historical census information or perhaps the results of a scientific investigation. There is a...
Category: Home & Education / Miscellaneous
Publisher: MightyMango, License: Shareware, Price: USD $0.00, File Size: 0
Platform: Windows

 Shareware
You don't have to be a programmer to create your own Explorer Bar. Explorer Bar (Band) Maker is a Windows tool (one-step wizard) that lets you create your own Explorer Bar from any Html page, picture or Macromedia Flash file. Usually, making Explorer bars includes COM programming, that can be complex and confusing. This work has done for you. Now, making...
Category: Internet / Web Accelerators
Publisher: Text-Reader Software, License: Shareware, Price: USD $98.00, File Size: 321.7 KB
Platform: Windows
Display your data with built-in graphs or WYSIWYG html editor. . .
Category: Software Development
Publisher: Olav Botterli Konsulenttjenester, License: Freeware, Price: USD $0.00, File Size: 6.3 MB
Platform: Windows, Linux

You don't have to be a programmer to create your own Explorer Bar. Explorer Bar (Band) Maker is a Windows tool (one-step wizard) that lets you create your own Explorer Bar from any Html page, picture or Macromedia Flash file. Usually, making Explorer bars includes COM programming, that can be complex and confusing. This work has done for you. Now, making...
Category: Software Development / Misc. Programming
Publisher: Text-Reader Software, License: Shareware, Price: USD $98.00, File Size: 322.1 KB
Platform: Windows

You don't have to be a programmer to create your own Explorer Bar. Explorer Bar (Band) Maker is a Windows tool (one-step wizard) that lets you create your own Explorer Bar from any Html page, picture or Macromedia Flash file. Usually, making Explorer bars includes COM programming, that can be complex and confusing. This work has done for you. Now, making...
Category: Internet / Web Accelerators
Publisher: Text-Reader Software, License: Shareware, Price: USD $98.00, File Size: 322.2 KB
Platform: Windows
HanengCharts enables you to easily add customized, dynamic, interactive charts to your Web site, intranet or Web application. No installation is required on the server, simply upload the small JAR file (80Kb) to the same folder as your Web page, add a few lines of Html code and you have your first chart. Use any technology that can output Html (like ASP.Net, ASP, PHP, JSP,...
Category: Internet
Publisher: Haneng Consult, License: Demo, Price: USD $399.00, File Size: 1.0 MB
Platform: Windows, Mac, Linux, Unix
Insight Graphing allows you to add graphs to your Clarion Windows, or Reports.
Insight Graphing allows you to add Graphs to your Clarion Windows, or Reports. But more importantly than just the ability, it also provides a powerful template interface which allows you to graph data directly out of your files, queues or memory. It also features complete control over the look of your graph, from the axis settings, to the graph itself, even the legend. You control the...
Category: Multimedia & Design / Multimedia App's
Publisher: Capesoft, License: Shareware, Price: USD $349.00, File Size: 968.0 KB
Platform: Windows
Displays graphs of algebraic functions in a variety of forms.
Displays Graphs of algebraic functions in a variety of forms. These include polar and cartesian co-ordinates, parametric and intrinsic functions. A wide Range of functions are built-in, from simple trig and hyperbolic functions to things such as the ceil and gamma functions. On-screen Html help is bulit-in.
Functions can be defined such as
f(x)= 1 + x
These...
Category: Home & Education / Mathematics
Publisher: Walter Milner, License: Freeware, Price: USD $0.00, File Size: 150.0 KB
Platform: Windows
Steam Properties is an MS Windows application that calculates properties of steam/water within a wide Range of pressure and temperature. The pressure Range is 0.01 Bar to 1000 Bar and the temperature Range is 0 C to 800 C. It is based on a set of equations accepted by the members of the Sixth International Conference on the Properties of Steam. The sets of...
Category: Business & Finance / Calculators
Publisher: Taftan Data, License: Shareware, Price: USD $25.00, File Size: 969.4 KB
Platform: Windows
Sushi Bar Express. Step in the shoes of a Japanese Sushi Chef and prepare the best raw fish for your customers. This is a family friendly game in the Snack Games Range of Xing Interactive. Don´t make the customers wait for too long or they will get angry.
Category: Games / Arcade
Publisher: Xing Interactive B.V., License: Shareware, Price: USD $0.00, File Size: 33.8 KB
Platform: Windows
Yaldex StatusTitle Maker generates JavaScript code to show a message in the status or title Bar. For example, you can describe the destination of a link in the status or title Bar instead of showing the URL associated with it. Also there are many adjusted effects including: Uppercase Across, Flashing, Typewriter letter by letter and so on. Finally, there are 19 controlled...
Category: Utilities
Publisher: Yaldex Software, License: Shareware, Price: USD $14.20, File Size: 796.6 KB
Platform: Windows

This WYSIWYG (What You See Is What You Get) program creates JavaScript and Html code to open an URL in a new (PopUp) window. You can specify the properties of the new window (whether it is resizable, has a menu Bar, a so on). For example, you can use it to open a larger image in a separate window when the visitor clicks a thumbnail image. You can make the new window with exact...
Category: Software Development
Publisher: Yaldex Software, License: Shareware, Price: USD $14.10, File Size: 1.6 MB
Platform: Windows
MicroGraphs is a graphing library for .
MicroGraphs is a graphing library for .NET Compact Framework ie PocketPCs and SmartPhonesThe library can generate: - Line Graphs- Bar Graphs- Pie Graphs Graphs are interactive and show data on demand. Important Features :- Easy to code LineGraph, BarGraph and PieGraph- Interactive Graphs showing data on demand- Stylus based events show or hide 'nodal...
Category: Software Development / Components & Libraries
Publisher: MakeLogic, License: Commercial, Price: USD $29.99, File Size: 1.2 MB
Platform: Windows,
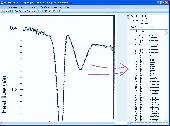
CurveUnscan makes easier, faster and more accurate the reverse engineering of graphs into data.
CurveUnscan makes easier, faster and more accurate the reverse engineering of Graphs into data.
Extracting data from Graphs is necessary for :
- Comparing data presented on Graphs in the litterature / internet with your own data
- Comparing different authors who present their results in Graphs.
- Refactoring documentation...
Category: Software Development / Misc. Programming
Publisher: SquarePoint Software, License: Shareware, Price: USD $72.17, File Size: 3.1 MB
Platform: Windows
SD-Graph v1.0 is a sophisticated bar graphing system that allows you to create and display colorful bar charts with detailed statistics.
Category: Software Development
Publisher: Spriteworks Developments, License: Demo, Price: USD $14.95, File Size: 18.1 KB
Platform: Unknown
Demo
Imagine a complete Graphing solution assisting you right from importing data and manipulating data, plotting Graphs, customizing looks, saving and exporting your Graphs as high quality images and producing dynamic reports of your data in a matter of a few easy steps. Features: Data Import: Connects effortlessly with your MS SQL Server, Oracle, Access, XLS and CSV files...
Category: Software Development / Databases & Networks
Publisher: Teknowledge LLC, License: Demo, Price: USD $99.00, File Size: 8.1 MB
Platform: Windows
The professional grade AJAX & JavaScript Bar Code Generator is pure JavaScript code that may be easily integrated with AJAX Web Applications and Html to create Bar-code images. Because it is pure JavaScript, no additional components, fonts or plug-ins need to be installed to create barcodes; it is the complete barcode generator. Supports Interleaved 2 of 5, MSI, Codabar,...
Category: Business & Finance
Publisher: IDAutomation.com, Inc., License: Demo, Price: USD $249.00, File Size: 38.3 KB
Platform: Windows, Mac, Linux

This WYSIWYG (What You See Is What You Get) program creates JavaScript and Html code to open an URL in a new (PopUp) window. You can specify the properties of the new window (whether it is resizable, has a menu Bar, a so on). For example, you can use it to open a larger image in a separate window when the visitor clicks a thumbnail image. You can make the new window with exact...
Category: Web Authoring / JavaScript
Publisher: Yaldex Software, License: Shareware, Price: USD $14.10, File Size: 1.6 MB
Platform: Windows

This WYSIWYG (What You See Is What You Get) program creates JavaScript and Html code to open an URL in a new (PopUp) window. You can specify the properties of the new window (whether it is resizable, has a menu Bar, a so on). For example, you can use it to open a larger image in a separate window when the visitor clicks a thumbnail image. You can make the new window with exact...
Category: Web Authoring / JavaScript
Publisher: Yaldex Software, License: Shareware, Price: USD $14.10, File Size: 1.3 MB
Platform: Windows
This WYSIWYG program creates JavaScript and HTML code to open an URL in a new (PopUp) window.
This WYSIWYG program creates JavaScript and Html code to open an URL in a new (PopUp) window. You can specify the properties of the new window (whether it is resizable, has a menu Bar, a so on). For example, you can use it to open a larger image in a separate window when the visitor clicks a thumbnail image. You can make the new window with exact size of the image. If you specify...
Category: Web Authoring / JavaScript
Publisher: Yaldex Software, License: Shareware, Price: USD $14.10, File Size: 1.6 MB
Platform: Windows
RLPlot is is a plotting program to create high quality graphs from data.
RLPlot is is a plotting program to create high quality Graphs from data. Based on values stored in a spreadsheet several menus help you to create Graphs of your choice. The Graphs are displayed as you get them (Wysiwyg). Double click any element of the gr
Category: Multimedia & Design
Publisher: rlplot.sourceforge.net, License: Freeware, Price: USD $0.00, File Size: 1024.0 KB
Platform: Windows, Mac, 2K, 2K3
dcsDigitiser, a graph digitizer and densitometer, converts Graphs into digital X-Y numerical numbers for peer analysis of Graphs and gel in the open literature and/or of your own hard copies. With excellent performance, dcsDigitiser is accurate, precise, versatile and straightforward in its use. It is now only a few clicks to get a numerical reading of Graphs of interest...
Category: Home & Education / Mathematics
Publisher: J & C Consultation and Technology, License: Shareware, Price: USD $120.00, File Size: 3.8 MB
Platform: Windows

If you are looking for an easy way to print bar codes from Windows, this font set is your answer!
If you are looking for an easy way to print Bar codes from Windows, this font set is your answer! You get five of the most popular Bar code formats, plus OCR-A and OCR-B fonts. These scalable TrueType fonts give you true WYSIWYG Bar codes in any Windows application. This Range of Bar code types let you Bar code virtually anything.
This package...
Category: Business & Finance / Inventory Systems
Publisher: Elfring Fonts, Inc, License: Demo, Price: USD $149.50, File Size: 847.0 KB
Platform: Windows
Grab It! is a Microsoft Excel based application that digitizes Graphs or charts to obtain the original data. Graphs and charts can have data point values digitized or photos can have angle and distance measurements made. All data is placed directly into Excel for easy re-use. Skewed Graphs are handled automatically (sometimes scanning isn't perfectly straight) as well as...
Category: Business & Finance
Publisher: DataTrend Software Inc, License: Demo, Price: USD $69.95, File Size: 840.1 KB
Platform: Windows