Free Downloads: Ir Data To Graph Maker
GetData Graph Digitizer is a program built for getting raw Data out of visual graphs for analytical purposes. Most of the comparative Data are usually visualized by graphs and charts. This software helps you in converting these visual Data in to figures and export in to sheets in desired formats.
The software works on simple procedure of opening the...
Category: Business & Finance / Database Management
Publisher: getdata-graph-digitizer.com, License: Shareware, Price: USD $30.00, File Size: 1.0 MB
Platform: Windows
Fly-through 3D graph software for exciting presentations, marketing, sales, analysis and fun!
Fly-through 3D Graph software for exciting presentations, marketing, sales, analysis and fun! Capture the attention of your audience with spectacular 3D technology. Instead of showing your audience another boring line Graph, capture their interest with something wildly different. They will be more likely to talk about and remember your presentation that had something that stood...
Category: Business & Finance
Publisher: Swan Studios, License: Shareware, Price: USD $39.95, File Size: 8.5 MB
Platform: Windows
With The Option Strategy Builder you could pick up an option and place it directly to the return Graph. As with the online tool, just drag and drop the option on the Graph, and build your strategy. Using your mouse, the options can be easily moved on the Graph to different strike prices, and to different expiration dates.
With this program you can manage your...
Category: Multimedia & Design / Multimedia App's
Publisher: SamoaSky, License: Freeware, Price: USD $0.00, File Size: 3.1 MB
Platform: Windows
This free program plots in realtime all Data sent and received using the Dial-Up Networking Adapter and Modem. Shows separate sent, received, send rate, received rate, peaks and totals. Five graphs and statistics. Animated System Tray Icon. Allows you to change colours, Graph size, sample seconds, 3D Graph, axis and more. Full automated self-upgrade. Autostart with...
Category: Internet / Dial-up & Connectivity
Publisher: Ashok Kumar Parmar, License: Freeware, Price: USD $0.00, File Size: 819.2 KB
Platform: Windows
ImageDIG consists of three integrated modules which allow the user to convert 2D flat images into 3D (x,y,z) Data or if a Graph, convert the Graph in image form into 2 dimensional numerical Data. The third module is a full analysis plotting utility where the user can import either the 2D or 3D Data saved above or import any number of columns of Data...
Category: Business & Finance / Applications
Publisher: SciCepts Engineering, License: Shareware, Price: USD $49.95, File Size: 0
Platform: Windows

Audio Graph ActiveX is an ActiveX (OCX) component for software developers. With this ActiveX component you can display a meter, detect a silence, and display 2 types of audio graphs by the WaveIn/WaveOut buffers. Just send a pointer of the buffers array to the component then operate the Display function, the component will do the rest on the Graph view. You can set the...
Category: Software Development
Publisher: expresslib.com, License: Shareware, Price: USD $69.00, File Size: 806.5 KB
Platform: Windows
Excel Graph Multiple Equations Software is an application that allows you to plot multiple functions in Microsoft Excel. It is able to create multiple charts based on the formulas entered. You can enter an equation manually or load multiple equations from a text file (.txt). The application is able to plot each equation on an individual Graph or all the equations on a single...
Category: Business & Finance / MS Office Addons
Publisher: Sobolsoft, License: Shareware, Price: USD $19.99, File Size: 2.5 MB
Platform: Windows
Graph Digitizer Scout automatically converts hard-copy graphs, oscillograms, charts, plots, into X,Y. Different recognition methods including manual correction mode. Data can be exported to Excel, CSV format and other applications.
Category: Home & Education / Mathematics
Publisher: ByteScout, License: Demo, Price: USD $35.00, File Size: 5.2 MB
Platform: Windows
HOBOware Data logging software lets you view, Graph and analyze Data with point-and-click simplicity. You can easily setup your application in a matter of minutes, quickly readout and plot Data, and export to spreadsheets for further analysis.
Features of HOBOware Pro Data Logging Software:
Presentation quality graphics
Powerful...
Category: Multimedia & Design / Digital Media Editors
Publisher: Onset Computer Corporation, License: Shareware, Price: USD $84.00, File Size: 101.0 MB
Platform: Windows

Archim is a program for drawing the graphs of all kinds of functions. You can define a Graph explicitly and parametrically, in polar and spherical coordinates, on a plane and in space (surface). Archim will be useful for teachers and students, as well as for everyone who is interested min geometry. With Archim, you will draw the Graph of any function and form, just use your...
Category: Home & Education
Publisher: Stochastic Lab, License: Freeware, Price: USD $0.00, File Size: 479.6 KB
Platform: Windows
Graph-A-Ping allows you to visually see the ping latency between ping times.
Graph-A-Ping allows you to visually see the ping latency between ping times. The bigger the gap between one ping to another allows you to spot possible network bottle neck.
This tool is actually an applet part of Glass Net Networks monitoring console.
Category: Internet / Misc. Plugins
Publisher: Mataluis.Com, License: Freeware, Price: USD $0.00, File Size: 2.1 MB
Platform: Windows
Graph FAWM is a function graphing tool that is easy for teachers and students to use.
Graph FAWM is a function graphing tool that is easy for teachers and students to use. A wealth of information is available about any Graph just by moving the mouse pointer to a point of interest.
Category: Business & Finance / Applications
Main Features:
- True algebraic equation format
- Implicit equations
- Locates intercepts, turning points and points of intersection
Publisher: New FAWM Creations, License: Shareware, Price: USD $20.00, File Size: 4.6 MB
Platform: Windows
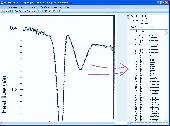
dcsDigitiser, a Graph digitizer and densitometer, converts graphs into digital X-Y numerical numbers for peer analysis of graphs and gel in the open literature and/or of your own hard copies. With excellent performance, dcsDigitiser is accurate, precise, versatile and straightforward in its use. It is now only a few clicks to get a numerical reading of graphs of interest while surfing on...
Category: Home & Education / Mathematics
Publisher: J & C Consultation and Technology, License: Shareware, Price: USD $120.00, File Size: 3.8 MB
Platform: Windows
Visual Menu Maker/Free is an intuitive wizard for the rapid development of professional looking menus. Visual Menu Maker/Free offers 100% standards compliant CSS and XML Data formats, allowing for complete separation between content and presentation. Visual Menu Maker/Free creates compiled and compressed Data files, making it the fastest loading menu...
Category: Web Authoring / JavaScript
Publisher: VisualMenu.com, License: Freeware, Price: USD $0.00, File Size: 1.1 MB
Platform: Windows
aiSee reads a textual, easy-to-read and easy-to-learn Graph specification and automatically calculates a customizable Graph layout. This layout is then displayed, and can be interactively explored, printed and exported to various graphic formats.
See has been optimized to handle huge graphs automatically generated by applications. It is available for Windows, Linux, and Mac...
Category: Home & Education / Miscellaneous
Publisher: Ai-See, License: Shareware, Price: USD $395.00, File Size: 18.2 MB
Platform: Windows
TI-Graph LINK for Windows is a Windows-based integrated communication link and Data manager for the PC.
Main features:
· Transfer Data between the calculator and a PC.
· Save TI-83 Plus screen images on the PC for use in word processing, desktop publishing, or page-layout applications.
· Print TI-83 Plus screen...
Category: Utilities / Misc. Utilities
Publisher: Texas Instruments, Inc., License: Freeware, Price: USD $0.00, File Size: 1.2 MB
Platform: Windows
CoGui is a free Graph-based visual tool, developed in Java, for building Conceptual Graph knowledge bases represented in COGXML format, compatible with Cogitant.
Category: Multimedia & Design / Video
Features:
- Intuitive visual structures for building real-world knowledge bases
- Reasoning capabilities with Cogitant
- XML persistent storage
Functionalities:
Publisher: LIRMM, License: Shareware, Price: USD $0.00, File Size: 0
Platform: Windows
SBHistogram generates simple histograms from simple ASCII data files.
SBHistogram generates simple histograms from simple ASCII Data files. It's a simple tool designed to be easy to use.
A histogram is a chart in which Data values in counted and placed into buckets. For example, let's assume you want to do a histogram of peoples ages. Then you might want to use buckets such as 1-10 years, 11-20 years, 21-30 years, etc. Each bucket...
Category: Multimedia & Design / Multimedia App's
Publisher: SB-Software, License: Freeware, Price: USD $0.00, File Size: 604.0 KB
Platform: Windows
Graph visualization is a way of representing structural information as diagrams of abstract graphs and networks. Automatic Graph drawing has many important applications in software engineering, database and web design, networking, and in visual interfaces
Category: Multimedia & Design
Publisher: graphviz.org, License: Freeware, Price: USD $0.00, File Size: 26.6 MB
Platform: Windows, Mac, Vista
WTides is a free program that uses harmonics Data to predict tide heights at many locations throughout the World, and displays a Graph of the results according to the time zone of the target location. The tide Graph can be overlaid with a solunar chart to give an interesting version of the Maori Fishing Calendar. The program runs on any version of Microsoft Windows from...
Category: Multimedia & Design / Digital Media Editors
Publisher: Managing Data Resources (NZ) Ltd, License: Freeware, Price: USD $0.00, File Size: 601.9 KB
Platform: Windows
Insight Graphing allows you to add graphs to your Clarion Windows, or Reports.
Insight Graphing allows you to add graphs to your Clarion Windows, or Reports. But more importantly than just the ability, it also provides a powerful template interface which allows you to Graph Data directly out of your files, queues or memory. It also features complete control over the look of your Graph, from the axis settings, to the Graph itself, even the...
Category: Multimedia & Design / Multimedia App's
Publisher: Capesoft, License: Shareware, Price: USD $349.00, File Size: 968.0 KB
Platform: Windows
Add Powerful reporting features to your Web / Intranet pages and applications. With the advanced graphing package you will be quickly adding impressive dynamic charting capabilities bringing your Data alive ! Powerful components provide both client & server side solutions for adding graphs & charts into web / intranet pages & applications. Enabling web authors & Java developers to easily...
Category: Internet
Publisher: Sirius Computer Consultants Limited, License: Shareware, Price: USD $195.00, File Size: 389.6 KB
Platform: Windows, Linux, OS/2, Mac, Unix
Long sections for the design of pipe lines can be created by using the design options available in PIPE Maker. Ground long-section Data can be extracted from tacheometric survey Data using MODEL Maker or it can be input manually.
This program contains all the different input Data to cater for the design of water, stormwater or sewer pipes. Earthworks and...
Category: Web Authoring / Web Design Utilities
Publisher: Model Maker Systems, License: Freeware, Price: USD $0.00, File Size: 3.6 MB
Platform: Windows
The NetGraph – network monitor 2.
The NetGraph – network monitor 2.0 is a software network-monitoring program that enables users to see at a glance the activities on their networks including the volumes of traffic with four simple Graph mode indicators.
The program works on any Windows’ network connection and NetGraph – network monitor 2.0’s four modes include 2 snapshot modes and 2...
Category: Internet / Monitoring
Publisher: Nikola Dachev, License: Freeware, Price: USD $0.00, File Size: 0
Platform: Windows
Graphe Easy is a feature-rich yet easy-to-use 2d-graph plotting Windows software.
Graphe Easy is a feature-rich yet easy-to-use 2d-Graph plotting Windows software. It allows to draw many Graph types (cartesian, polar, parametric coordinates) and many other graphs such as conics, integrals, inequations or sequences. It also provides a wide range of tools to comment on the graphics and get high quality results.
Category: Utilities / System Utilities
Publisher: Olivier ANSQUER, License: Shareware, Price: USD $39.00, File Size: 4.2 MB
Platform: Windows