Free Downloads: Ohlc Bar Charts
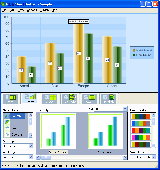
MindFusion.Charting.WebForms provides applications targeting the .NET platform the ability to create and display various kinds of Charts. The component supports Bar, pie, doughnut, scatter, bubble, line, area, radar and polar Charts. Many features of MindFusion.Charting.WebForms output can be customized in a way that suits your project best. Charts can have different...
Category: Software Development / Misc. Programming
Publisher: MindFusion, License: Demo, Price: USD $0.00, File Size: 5.0 MB
Platform: Windows
 Commercial
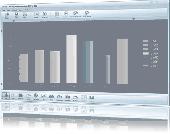
Charting tool for the rapid design of 13 different chart types, including Bar, dot, horizontal Bar, line, pie, donut, scatter, xy, area, histogram, error Bar, bubble, gantt and volume Charts. Additional features include 3D, multiple datasets, gradients, transparency, unlimited annotations, and smoothing. Can be exported to files of types BMP, GIF, PNG, PS, PDF, EMF,...
Category: Business & Finance / Applications
Publisher: Creative-PC, License: Commercial, Price: USD $49.00, File Size: 7.6 MB
Platform: Windows
Freeware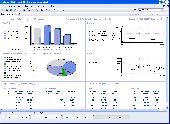
MyOra is a free SQL Tool for Oracle database developers and DBAs. This tool is simple, fast and easy to use, requires no installation, no Oracle client and no internet connection. Just download, unzip and start using with a click of the mouse, run SQL queries and Monitor database performance in Real Time. MyOra’s MDI (Multi Document Interface) framework handles multiple sub-windows opened at...
Category: Software Development / Databases & Networks
Publisher: Jayam Systems, LLC, License: Freeware, Price: USD $0.00, File Size: 1.0 MB
Platform: Windows
All charts are displayed in one window.
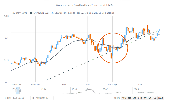
All Charts are displayed in one window. User may compare different Charts of one stock or Charts of different stocks easily.
- Advanced indicators: EquiVolume, Point & Figure, GMMA, Heiken-Ashi, Volatility Stop Loss.
Point & Figure Charts consist of columns of X's and O's that represent filtered price movements over time. It is...
Category: Multimedia & Design / Multimedia App's
Publisher: Stock-Anal, License: Shareware, Price: USD $0.00, File Size: 0
Platform: Windows
Heikin Ashi4MetaStock is a software program that allows MetastockTM users to create and update Heikin Ashi data files in MetaStock. The program creates data files with modified open, high, low, close values and according to the computation rules for Heikin-ashi trend technique. Once these data files are created/updated, they can be displayed as Heikin Ashi trend Charts in MetastockTM...
Category: Business & Finance
Publisher: Trading-Tools.com, License: Shareware, Price: USD $47.00, File Size: 961.2 KB
Platform: Windows
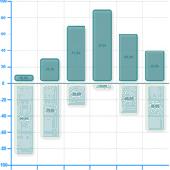
Web Enabled solution for creating Stacked Horizontal Charts & Graphs.
Web Enabled solution for creating Stacked Horizontal Charts & Graphs. Versatile components for web authors and developers to easily build and publish dynamic and interactive Bar graphs. Database Access Methods (Direct Data Binding and Multi-Tier)Template Scripts and Implementations (ASP, JSP, PHP and Servlet Code)Documentation, Demo Implementations and Tutorial Guides.Dynamic...
Category: Software Development / Tools & Editors
Publisher: Sirius Computer Consultants Limited, License: Shareware, Price: USD $49.95, File Size: 252.0 KB
Platform: Windows
TeeChart ActiveX includes 60+ Chart types in 2D, 3D to visualize data. From the common Line, Bar, Area, Pie chart to the field-specific Charts like Candle Ohlc, Point and Figure, Volume, High-Low,BoxPlot,etc It provides a large selection Financial and Statistical Indicators that perform calculations ranging from basic mean; Mode Function, Median Function to the more...
Category: Software Development / Components & Libraries
Publisher: Steema Software, License: Shareware, Price: USD $469.00, File Size: 52.3 MB
Platform: Windows
Tool to easily follow the stock market using Point and Figure charts.
Tool to easily follow the stock market using Point and Figure Charts. Get a set of updated Charts everyday in your mailbox (or if you prefer download the Charts files from our website) We have Charts of the following markets: US US mutual funds, ETF's and iShares Canada United Kingdom Europe Australia Select stocks in minutes with our 'Buy the Winner' view! Comes...
Category: Business & Finance / Applications
Publisher: Magic Potion, License: Demo, Price: USD $49.00, File Size: 7.6 MB
Platform: Windows,
AnyChart Stock and Financial JS Charts (short: AnyStock) is a JavaScript based financial and stock charting library, also used for visualizing any timeline data over a long time. AnyStock technology turns your real-time data into highly sophisticated Charts with interactive features, bringing visualization of your data to the Web and providing a full feature set for creating...
Category: Web Authoring / JavaScript
Publisher: AnyChart JavaScript Charts, License: Shareware, Price: USD $49.00, File Size: 17.7 MB
Platform: Windows, Mac, Linux,
Parity Plus is one of the most powerful Stock Charting and Technical Analysis Programs available on the market. Parity includes over 50 of the most popular indicators for the technical analysis of stocks and commodities. The majority of these indicators act as functions that return an array, which can be used as the input to another indicator or within a user defined formula. This makes it easy...
Category: Business & Finance / Project Management
Publisher: DITEC International, License: Shareware, Price: USD $122.00, File Size: 634.9 KB
Platform: Windows
Urania offers broad range of astrological techniques, among them are synastry concentric Charts up to 5 wheels, multiple composite up to 25 natal Charts, broad range of transit and progress lists, comparison progressed lists, graphical Bar transit lists 'in-orb period', astrocartography and cyclocartography with planets on asc and/or on horizon, aspect figures...
Category: Home & Education / Astrology & Numerology
Publisher: AstroSfera, License: Demo, Price: USD $0.00, File Size: 28.9 MB
Platform: Windows
FutureWare Personal Glucose Tracker is an application that maintains and displays daily readings in a set of color-coded Bar Charts, which can be printed in tabular and bargraph form on any desktop printer. The Charts can be stored, brought, or faxed to a doctor's office.
Category: Home & Education / Health & Nutrition
Publisher: FutureWare SCG, License: Shareware, Price: USD $29.00, File Size: 2.0 MB
Platform: Windows
The Gantt Chart Builder System provides a system to build professional quality Gantt Charts without the need for Microsoft Project or similar products.Charts can be constructed with either Microsoft Excel or Access. This version is the Excel version. Quite often, your data is present in a database and the production of such Charts has been extremely difficult without...
Category: Business & Finance / Project Management
Publisher: Bandwood Pty Limited, License: Demo, Price: USD $69.95, File Size: 6.9 MB
Platform: Windows
Shareware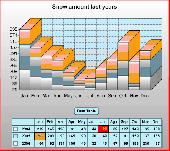
Super 2d/3d Graph Library is a customizable and powerful, yet light, .NET libray for drawing eye-candy Charts and/or export them into PDF format, vector (Scalable Vector Graphics or SVG) and raster graphics file formats such as JPG, GIF, PNG, BMP, ... Same component may be used in WinForms or ASP.NET applications. Powerful features such as high resolution render, additional calculations,...
Category: Software Development / Components & Libraries
Publisher: Software Siglo XXI, License: Shareware, Price: USD $129.00, EUR99, File Size: 1.2 MB
Platform: Windows
Rapid Charts provides the tools you need to help make creating Charts and graphs for use in web sites or applications as straightforward as possible. Chart definitions allow you to easily save the chart for later use, save the definition to a shared database to share the chart with others or for use in a web page. Charts can be saved to a jpg or png file for inclusion in...
Category: Audio / Utilities & Plug-Ins
Publisher: LLamedos Software, License: Shareware, Price: USD $14.95, File Size: 4.2 MB
Platform: Windows
The Gantt Chart Builder System provides a system to build professional quality Gantt Charts without the need for Microsoft Project or similar products.Charts can be constructed with either Microsoft Excel or Access. This version is the Access version. Quite often, your data is present in a database and the production of such Charts has been extremely difficult without...
Category: Business & Finance / Project Management
Publisher: Bandwood Pty Limited, License: Demo, Price: USD $59.95, File Size: 4.9 MB
Platform: Windows
Chart Trainer -Learn to read nautical charts like an expert.
Chart Trainer -Learn to read nautical Charts like an expert.
Chart Trainer is designed to help mariners interpret nautical Charts and use them more efficiently, both traditional paper Charts and new digital Charts for computers. The materials cover all aspects of nautical Charts in the most detail available, including tutorials on chart reading and...
Category: Home & Education / Teaching Tools
Publisher: Starpath School of Navigation, License: Shareware, Price: USD $39.00, File Size: 39.8 MB
Platform: Windows
Shareware
XML Flash Charts are easy to make using Animated Chart Pro. Create dynamic web chart with live data permanently updated from XML source. Animated Chart Pro edition generates real time web Charts using dynamic data and all you have to do is to customize chart appearance, get the result and embed an interactive dynamic flash chart into your Web page. Flash skills is not required!...
Category: Web Authoring / Website Animation Tools
Publisher: Flarium, License: Shareware, Price: USD $69.00, File Size: 2.7 MB
Platform: Windows
Manco.Chart for WPF is the perfect solution to add the most advanced, feature rich Charts to Windows Presentation Foundation applications. Over 40 major 2D/3D Charts are available, such as traditional area, Bar, column, line and pie Charts, financial bars and Japanese candlesticks, Kagi and Renko Charts and others. Flexible areas filling, scaling, legends,...
Category: Software Development / Components & Libraries
Publisher: Manco Software, License: Shareware, Price: USD $58.95, EUR39, File Size: 3.5 MB
Platform: Windows
The PDF Chart Creator Dynamic Link Library (DLL) allows you to create area Charts, Bar Charts, line Charts and pie Charts from data as high quality PDF documents. The conversion process is fully controlled through the provided Application Programming Interface (API) which is provided with many language specific Application Program Interface files...
Category: Software Development
Publisher: Utility Warrior, License: Shareware, Price: USD $59.99, File Size: 401.6 KB
Platform: Windows
Rich Chart Builder transforms your data Charts into enjoyable and captivating communication. Data Charts don't have to be plain and austere, they can be interactive experiences with attractive visuals, animation and even voice explanations describing the important facts behind the numbers. Features and Benefits: - Impressive Charts: Create stunning Rich Media...
Category: Multimedia & Design
Publisher: Blue Pacific Software, License: Shareware, Price: USD $225.00, File Size: 4.6 MB
Platform: Windows
Aspose.Chart is a .Net charting component. With it, you can: ceeate more than 20 basic Charts types including Area, Bar, Bubble, Contour, Candlestick, Cube, Curve, CurveArea, Doughnut, Gantt, HighLowClose, Line, OpenHighLowClose, Pareto, Pie, Pyramid, Point, Radar, Scatter, Step, Surface, etc; Create Charts with effects including 3D, frame border, anti-alias, transparency,...
Category: Software Development / Components & Libraries
Publisher: Aspose Pty Ltd, License: Shareware, Price: USD $249.00, File Size: 1.1 MB
Platform: Windows
Shareware
SizeMeNow allows you to easily and effortlessly explore and visualize your disk space usage and folder sizes, as well as quickly identify and remove temporary, duplicate, and other unneeded files, freeing up gigabytes of space in minutes. It comes complete with a number of various reporting styles, as well as clear, beautiful Bar and pie Charts to represent disk usage in a...
Category: Utilities / File & Disk Management
Publisher: Ketara Software, License: Shareware, Price: USD $19.99, File Size: 2.5 MB
Platform: Windows
AnyChart is a robust and superfast JavaScript charting library to add great-looking, interactive HTML5 Charts into any project, in any browser, and on any platform/OS including mobile ones. AnyChart provides advanced customization and flexibility opportunities, no matter if you are developing a website, a business intelligence application (BI) for corporate usage, or some software for...
Category: Web Authoring / JavaScript
Publisher: AnyChart JavaScript Charts, License: Shareware, Price: USD $49.00, File Size: 17.8 MB
Platform: Windows, Mac, Linux,
Stock Chart Wizard downloads freely available stock market data on individual stocks and displays technical Charts and indicators. You enter in the stock tickers you wish to
analyze, and within seconds, line or Bar Charts are displayed along with selected moving averages and indicators.
Category: Business & Finance / MS Office Addons
Publisher: stockchartwizard.com, License: Shareware, Price: USD $19.00, File Size: 0
Platform: Windows